









Japanで最高のAirbnb投資市場 (2026年)

September 2025 to August 2026のAirbticsデータに基づき、このページではJapanでのAirbnb投資に最適な場所を紹介します。短期賃貸規制、リスティング数、稼働率、平均客室単価(ADR)、年間収益などの主要な統計データを確認できます。これにより、JapanでAirbnb物件を投資・購入・運営するのに最も収益性の高い都市を見つけることができます。

このページの市場はリスティング数ではなく、Airbticsの市場グレードで順位付けしています。グレードは利回り、収益成長、稼働率(需要)をこのランキング内の他市場と比べ、短期賃貸の規制で調整します。

  1. 利回り: 年間の短期賃貸収益を物件価格で割った値です。高いほど順位が上がります。
  2. 成長: 収益の前年比の変化です。成長が速いほど順位が上がります。
  3. 需要: 直近12か月の平均稼働率です。高いほど順位が上がります。
データの収集方法と精度について詳しく見る

最終更新日: 16th October, 2026

Japan 短期賃貸市場の概要 (2025年分析)

Japan 全域の市場平均値
平均稼働率 i
65.25%
平均年間収益 i
JPY5,085,785
平均客室単価 (ADR) i
JPY20,781
供給の伸び (YoY) i
43.14%
収益の変化 (YoY) i
-4.48%

2026年 Airbnbに最適なJapanのTop 12都市

追跡 ランク 市場グレード 都市・市場名 規制状況 リスティング数 平均稼働率 平均客室単価 収益 利回り 収益成長率
1BOkinawa
Strict
3,72869%JPY21,643JPY5,741,91217.0%+4.1%
2BSapporo
Strict
2,64063%JPY17,566JPY4,243,93319.9%-6.7%
3BNagano
Strict
2,14956%JPY29,642JPY6,165,06627.1%-7.5%
4BFukuoka
Strict
2,05679% 🚀JPY15,684JPY4,671,793Unlock in Market ExplorerUnlock in Market Explorer
5CKyoto
Strict
4,60973%JPY22,584JPY6,206,001Unlock in Market ExplorerUnlock in Market Explorer
6CKanagawa
Strict
1,73864%JPY20,546JPY5,066,559Unlock in Market ExplorerUnlock in Market Explorer
7CShizuoka
Strict
1,70349%JPY25,094JPY4,744,410Unlock in Market ExplorerUnlock in Market Explorer
8C+Chiba
Strict
1,77251%JPY23,055JPY4,498,798Unlock in Market ExplorerUnlock in Market Explorer
9C+Yamanashi
Strict
1,48765%JPY26,976JPY6,696,911Unlock in Market ExplorerUnlock in Market Explorer
10C+Hiroshima
Strict
1,14064%JPY14,586JPY3,670,840Unlock in Market ExplorerUnlock in Market Explorer
11D+Tokyo
Strict
25,21784% 🚀JPY19,605JPY6,184,044Unlock in Market ExplorerUnlock in Market Explorer
12EOsaka
Strict
13,55266%JPY12,390JPY3,139,152Unlock in Market ExplorerUnlock in Market Explorer

Data Seen By

インタラクティブツールで最適な市場を見つける

Airbticsのインタラクティブ・マーケット・エクスプローラーを使用して、JapanでAirbnbを開始するのに最適な場所を見つけましょう。複数の市場を並べて比較したり、規制、予算(物件価格または賃料)、市場規模でフィルタリングしたり、結果をExcelにエクスポートしたりできます。

インタラクティブツールを試す

2026年、なぜJapanのAirbnbに投資すべきなのか?

近年、Japanは、その人気のある観光名所、盛んなビジネス活動、増加するデジタルノマド、そしてOkinawa, Sapporo and Naganoのような活気ある都市のおかげで、短期賃貸投資のトップロケーションの1つとして浮上しています。毎年数百万人もの海外旅行者が訪れる中、バケーションレンタルの需要は着実に増加しており、JapanのAirbnbは国内外の投資家にとって収益性の高い選択肢となっています。

旺盛な旅行需要により、Japanの主要なAirbnb市場では、競争力のある平均客室単価(ADR)、安定した稼働率、そして魅力的な収益の可能性を提供しています。小規模な予算で最初のAirbnbビジネスを立ち上げる場合でも、ポートフォリオに高級物件を追加する場合でも、Japanには投資家の予算と目標に合った収益性の高い場所があります。

Top 3 Airbnb markets in Japan by Market Grade

These are the three highest-graded Airbnb markets in Japan. Market Grade compares yield, revenue growth, and occupancy (demand) with the other markets on this page, then adjusts for short-term rental regulation. The chart repeats those three percentiles in text so the ranking is readable without the graphic.

Rank 1 — Okinawa (Grade B)

Okinawa is rank 1 of 12 markets in this Japan ranking by Airbtics Market Grade B, with 17.0% short-term rental yield, 69.0% occupancy, and +4.1% year-over-year revenue growth.

Compared with the other markets on this page, Okinawa ranks top 38% for yield, top 21% for growth, and top 29% for demand. The market shows an average daily rate of JPY21,643, annual revenue of JPY5,741,912, a rent gap of 4621.0%, 3,728 active listings, strict short-term rental regulation, and a typical 2-bedroom property price of JPY39,210,000.

  • Market gradeB
  • Yield17.0%
  • Revenue growth+4.1%
  • Occupancy69.0%
  • Average daily rateJPY21,643
  • Annual revenueJPY5,741,912
  • Rent gap4621.0%
  • Active listings3,728
  • 2-bedroom priceJPY39,210,000
  • RegulationStrict
top 38%Yieldtop 21%Growthtop 29%Demand

Percentile versus other Japan markets on this page. Farther from the center is stronger.

  • Yield: top 38%
  • Growth: top 21%
  • Demand: top 29%

Rank 2 — Sapporo (Grade B)

Sapporo is rank 2 of 12 markets in this Japan ranking by Airbtics Market Grade B, with 19.9% short-term rental yield, 63.0% occupancy, and -6.7% year-over-year revenue growth.

Compared with the other markets on this page, Sapporo ranks top 21% for yield, lowest 46% for growth, and lowest 29% for demand. The market shows an average daily rate of JPY17,566, annual revenue of JPY4,243,933, a rent gap of 5196.9%, 2,640 active listings, strict short-term rental regulation, and a typical 2-bedroom property price of JPY31,368,000.

  • Market gradeB
  • Yield19.9%
  • Revenue growth-6.7%
  • Occupancy63.0%
  • Average daily rateJPY17,566
  • Annual revenueJPY4,243,933
  • Rent gap5196.9%
  • Active listings2,640
  • 2-bedroom priceJPY31,368,000
  • RegulationStrict
top 21%Yieldlowest 46%Growthlowest 29%Demand

Percentile versus other Japan markets on this page. Farther from the center is stronger.

  • Yield: top 21%
  • Growth: lowest 46%
  • Demand: lowest 29%

Rank 3 — Nagano (Grade B)

Nagano is rank 3 of 12 markets in this Japan ranking by Airbtics Market Grade B, with 27.1% short-term rental yield, 56.0% occupancy, and -7.5% year-over-year revenue growth.

Compared with the other markets on this page, Nagano ranks top 12% for yield, lowest 38% for growth, and lowest 21% for demand. The market shows an average daily rate of JPY29,642, annual revenue of JPY6,165,066, a rent gap of 7640.1%, 2,149 active listings, strict short-term rental regulation, and a typical 2-bedroom property price of JPY31,368,000.

  • Market gradeB
  • Yield27.1%
  • Revenue growth-7.5%
  • Occupancy56.0%
  • Average daily rateJPY29,642
  • Annual revenueJPY6,165,066
  • Rent gap7640.1%
  • Active listings2,149
  • 2-bedroom priceJPY31,368,000
  • RegulationStrict
top 12%Yieldlowest 38%Growthlowest 21%Demand

Percentile versus other Japan markets on this page. Farther from the center is stronger.

  • Yield: top 12%
  • Growth: lowest 38%
  • Demand: lowest 21%

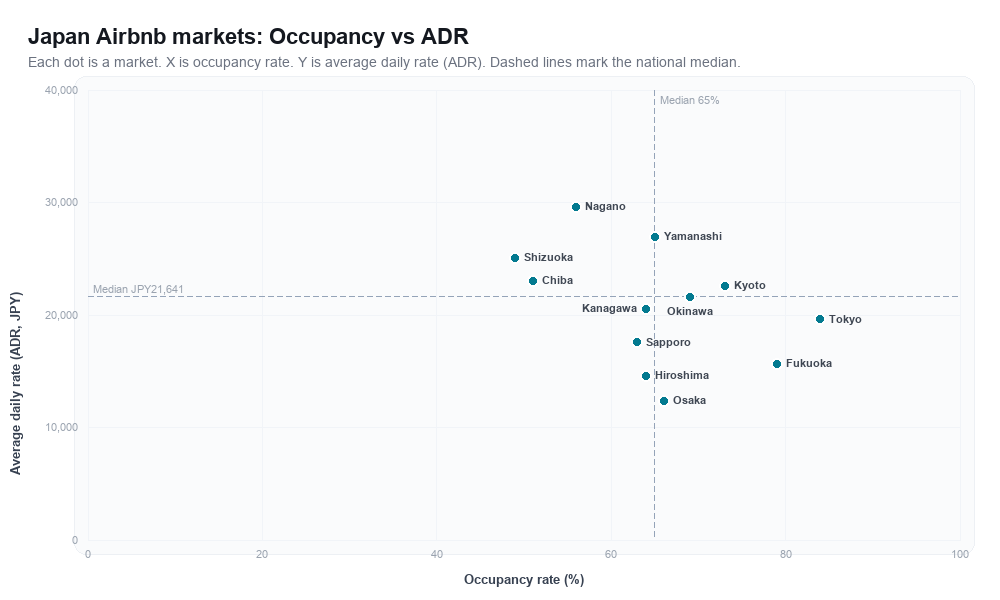
市場飽和度分析: Japan

Each dot is a vacation rental market in Japan, plotted by occupancy rate (x-axis) and average daily rate (ADR) (y-axis). Dashed lines mark the national median.

Japan Airbnb markets rankboard scatter chart showing occupancy rate versus average daily rate (ADR)
Occupancy rate and average daily rate for each Japan market plotted in the chart above, in Market Grade order.
MarketOccupancy rateAverage daily rate
Okinawa69.0%JPY21,643
Sapporo63.0%JPY17,566
Nagano56.0%JPY29,642
Fukuoka79.0%JPY15,684
Kyoto73.0%JPY22,584
Kanagawa64.0%JPY20,546
Shizuoka49.0%JPY25,094
Chiba51.0%JPY23,055
Yamanashi65.0%JPY26,976
Hiroshima64.0%JPY14,586
Tokyo84.0%JPY19,605
Osaka66.0%JPY12,390

Compare property prices, short-term rental yield, rent gap, annual revenue, and supply growth in the Airbtics Market Explorer watchlist.


JapanでのAirbnb収益を予測する


Japanで最も収益性の高い投資機会を探す準備はできましたか?

Airbnb収益計算機を使用して、あらゆる都市、近隣地域、エリアの収益可能性と収益率を迅速かつ正確に推定しましょう。

収益計算機を使ってみる

トレンド、供給、前年比の変化は、Japanの2025年短期賃貸市場レポートにまとめています。