fbpx
🎉 FREE WEBINAR - July 24th, 11am / 8pm CET - Learn Airbtics in 7 Minutes - Revenue and Market Analysis Tips and Best Practices!
Categories
Airbnb Occupancy All About Airbnb

Airbnb Occupancy Rate Tool – Check Occupancy Data for Any Markets

Instantly See An Average Airbnb Occupancy Rate

Discover 30+ Airbnb statistics of any city worldwide!

What Is Occupancy Rate?

It is the percentage of nights booked among the available nights on an Airbnb listing. How can you find the average occupancy rate of your market? 

How to find Airbnb Occupancy Rates?

Simply enter an address above, and it’ll show you the average occupancy rate of any address in the world for free! The average occupancy rate is calculated by 10-20 similar listings around the input addresses.

What Is a good Occupancy Rate?

We provide a simple guide: “70% is considered a good year-round occupancy rate.” About 20% of markets worldwide fall under this category. 

How does Airbtics collect this data?

As a short-term rental data company, we’ve been tracking Airbnb listing occupancy rates and bookings since 2019. This allows us to have comprehensive Airbnb statistics at listing level. 

Those statistics includes:

Why do you need to know the Airbnb Occupancy Rate?

Market Research: Starting on your Airbnb venture? Knowing the Airbnb rates in your area will steer you in the right direction. 

The two most important factors are 1) choosing the perfect location with the highest average occupancy rate and 2)  determining the right number of bedrooms because you can’t change these two once you commit to a property. 

If you want to know the right location, simply use Airbtics’ Airbnb Occupancy Rate map. 

Airbnb Occupancy Map

Get more bookings: Knowing the peak season allows you to maximize your profit by charging higher fees. During low season, you can consider giving a discount for long-term rates, or it might be the right timing for you to use it as your vacation home! 

Airbnb Occupancy Rate

4 Interesting AirBNB Occupancy Rate Facts

Are you thinking of investing on short-term rentals or already have a few? These are some Airbnb Occupancy rate statistics that can be useful for you to know to get more bookings. 

Summary: Take professional photos, get more reviews – at least 5 reviews, be a super host to maximise your occupancy rates! 

Average Airbnb Occupancy Rates by City (US)

  • Fort Collins Airbnb Active Listing: 2,533  Average Airbnb Occupancy Rate (2023): 68% Peak Season: July
  • Seattle Airbnb Active Listing: 5,791 Average Airbnb Occupancy Rate (2023): 76% Peak Season: July
  • Memphis Airbnb Active Listing: 1,488 Average Airbnb Occupancy Rate (2023): 58% Peak Season: April 
  • Milwaukee Airbnb Active Listing: 1,552 Average Airbnb Occupancy Rate (2023): 60% Peak Season:  July
  • Ontario, NY Airbnb Active Listing: 632 Average Airbnb Occupancy Rate (2023): 56% Peak Season: July
  • Phoenix Airbnb Active Listing: 7,600 Average Airbnb Occupancy Rate (2023): 60% Peak Season: March
  • Austin Airbnb Active Listing: 10,779 Average Airbnb Occupancy Rate (2023): 61% Peak Season: April
  • San Antonio Airbnb Active Listing: 5,290 Average Airbnb Occupancy Rate (2023): 57% Peak Season: July
  • Newark, NJ Airbnb Active Listing: 1,480 Average Airbnb Occupancy Rate (2023):  60% Peak Season: September
  • Houston Airbnb Active Listing: 10,263 Average Airbnb Occupancy Rate (2023): 56% Peak Season: July
  • Fresno Airbnb Active Listing: 1,830 Average Airbnb Occupancy Rate (2023): 54% Peak Season: July
  • Chicago Airbnb Active Listing: 6,634 Average Airbnb Occupancy Rate (2023): 66% Peak Season: July
  • New York Airbnb Active Listing:  10,048 Average Airbnb Occupancy Rate (2023): 72% Peak Season: June
  • Boston Airbnb Active Listing: 2,690 Average Airbnb Occupancy Rate (2023): 81% Peak Season: October
  • Gainesville, FL Airbnb Active Listing: 871 Average Airbnb Occupancy Rate (2023): 56% Peak Season: August
  • Nashville Airbnb Active Listing: 8,137 Average Airbnb Occupancy Rate (2023): 62% Peak Season: April
  • Miami Airbnb Active Listing:  8,533 Average Airbnb Occupancy Rate (2023): 61% Peak Season: March
  • Jacksonville Airbnb Active Listing: 8,874 Average Airbnb Occupancy Rate (2023): 59% Peak Season: March
  • Orlando Airbnb Active Listing: 1,351 Average Airbnb Occupancy Rate (2023): 64% Peak Season: March
  • Denver Airbnb Active Listing: 4,595 Average Airbnb Occupancy Rate (2023): 77% Peak Season: June
  • Pittsburgh, PA Airbnb Active Listing:  2,195 Average Airbnb Occupancy Rate (2023): 63% Peak Season:  July
  • Wichita, KS Airbnb Active Listing: 683 Average Airbnb Occupancy Rate (2023): 60% Peak Season: July
  • Kansas, MO Airbnb Active Listing: 3,433 Average Airbnb Occupancy Rate (2023): 61% Peak Season: July
  • Tampa Airbnb Active Listing:  3,820 Average Airbnb Occupancy Rate (2023): 62% Peak Season: March
  • Raleigh Airbnb Active Listing: 1,504 Average Airbnb Occupancy Rate (2023): 63% Peak Season: July
  • Baltimore Airbnb Active Listing: 1,769 Average Airbnb Occupancy Rate (2023): 58% Peak Season: June

Average Airbnb Occupancy Rates by City (Canada)

  • Toronto
    Airbnb Active Listing: 12,637 
    Average Airbnb Occupancy Rate (2023): 77 %
    Peak Season: September

  • Calgary
    Airbnb Active Listing: 5,290
    Average Airbnb Occupancy Rate (2023): 77 %
    Peak Season: July

  • Quebec
    Airbnb Active Listing: 1,443
    Average Airbnb Occupancy Rate (2023): 76 %
    Peak Season: July & August

  • Edmonton
    Airbnb Active Listing: 2,954
    Average Airbnb Occupancy Rate (2023): 69 % 
    Peak Season: July

  • Montreal
    Airbnb Active Listing: 7,605 
    Average Airbnb Occupancy Rate (2023): 74 %
    Peak Season: August

  • Vancouver
    Airbnb Active Listing: 5,478
    Average Airbnb Occupancy Rate (2023): 85 %
    Peak Season: June-August

  • Winnipeg
    Airbnb Active Listing: 1,588
    Average Airbnb Occupancy Rate (2023): 69 % 
    Peak Season: July

  • Kitchener
    Airbnb Active Listing: 793
    Average Airbnb Occupancy Rate (2023): 69% 
    Peak Season: September

  • Victoria
    Airbnb Active Listing: 1,267
    Average Airbnb Occupancy Rate (2023): 79 %
    Peak Season: July & August

  • London, ON
    Airbnb Active Listing: 830
    Average Airbnb Occupancy Rate (2023): 66 %
    Peak Season:  September

  • Halifax
    Airbnb Active Listing: 1,238
    Average Airbnb Occupancy Rate (2023): 84 % 
    Peak Season: July & August

  • Sudbury
    Airbnb Active Listing: 352
    Average Airbnb Occupancy Rate (2023): 67%
    Peak Season: April

  • Kingston
    Airbnb Active Listing: 453
    Average Airbnb Occupancy Rate (2023): 70 %
    Peak Season: August

  • Ottawa
    Airbnb Active Listing: 2,248
    Average Airbnb Occupancy Rate (2023): 69 %
    Peak Season: July

Average Airbnb Occupancy Rates by City (Australia)

 
  • Adelaide
    Airbnb Active Listing:  3,782
    Average Airbnb Occupancy Rate:  73 %
    Peak Season:  April

  • Perth
    Airbnb Active Listing: 5,312
    Average Airbnb Occupancy Rate: 87 %
    Peak Season: April

  • Canberra
    Airbnb Active Listing: 1,738
    Average Airbnb Occupancy Rate: 73%
    Peak Season: April

  • Newcastle
    Airbnb Active Listing: 1,125
    Average Airbnb Occupancy Rate: 62%
    Peak Season: January

  • Melbourne
    Airbnb Active Listing: 20,327
    Average Airbnb Occupancy Rate:  66 %
    Peak Season: April

  • Brisbane
    Airbnb Active Listing: 3,901
    Average Airbnb Occupancy Rate: 85 %
    Peak Season: July

  • Sydney
    Airbnb Active Listing: 11,732
    Average Airbnb Occupancy Rate: 79% 
    Peak Season: April

  • Darwin
    Airbnb Active Listing: 1,110
    Average Airbnb Occupancy Rate: 69%
    Peak Season: August

  • Wollongong
    Airbnb Active Listing: 855
    Average Airbnb Occupancy Rate: 64%
    Peak Season: January

  • Hobart
    Airbnb Active Listing: 1,057
    Average Airbnb Occupancy Rate: 72%
    Peak Season: April

  • Toowoomba
    Airbnb Active Listing: 303
    Average Airbnb Occupancy Rate: 75%
    Peak Season: April

  • Central Coast
    Airbnb Active Listing: 2,598
    Average Airbnb Occupancy Rate: 43%
    Peak Season: January

  • Ballarat
    Airbnb Active Listing: 510 
    Average Airbnb Occupancy Rate: 510
    Peak Season: April

  • Greater Bendigo
    Airbnb Active Listing: 484
    Average Airbnb Occupancy Rate: 60%
    Peak Season: April 

Average Airbnb Occupancy Rates by City (UK)


  • London
    Airbnb Active Listing: 4,000
    Average Airbnb Occupancy Rate: 87%
    Peak Season: June & July

  • Edinburgh
    Airbnb Active Listing: 6,857
    Average Airbnb Occupancy Rate: 91%
    Peak Season: June- September

  • Liverpool
    Airbnb Active Listing: 3,376
    Average Airbnb Occupancy Rate: 57%
    Peak Season: April

  • Manchester
    Airbnb Active Listing: 2,338 
    Average Airbnb Occupancy Rate: 66%
    Peak Season: July

  • Glasgow
    Airbnb Active Listing: 2,329
    Average Airbnb Occupancy Rate: 76%
    Peak Season: 76%

  • Leeds
    Airbnb Active Listing: 1,465 
    Average Airbnb Occupancy Rate: 65%
    Peak Season: July

  • York
    Airbnb Active Listing: 1,730
    Average Airbnb Occupancy Rate: 66%
    Peak Season: July

  • Birmingham
    Airbnb Active Listing: 2,762
    Average Airbnb Occupancy Rate: 61%
    Peak Season: July

  • Nottingham
    Airbnb Active Listing: 1,212
    Average Airbnb Occupancy Rate: 61 %
    Peak Season: September

  • Bristol
    Airbnb Active Listing: 2,299
    Average Airbnb Occupancy Rate: 77 %
    Peak Season: September

  • Sheffield
    Airbnb Active Listing: 1,114
    Average Airbnb Occupancy Rate: 61%
    Peak Season: July

  • Cardiff
    Airbnb Active Listing: 1,880
    Average Airbnb Occupancy Rate: 60%
    Peak Season: July

  • Aberdeen
    Airbnb Active Listing: 725
    Average Airbnb Occupancy Rate: 70%
    Peak Season: July

  • Belfast
    Airbnb Active Listing: 1,446 
    Average Airbnb Occupancy Rate:  74%
    Peak Season:  74%

Average Airbnb Occupancy Rates (Top 50 Global Cities)


  • Amsterdam, Netherlands
    Airbnb Active Listing: 5,778
    Average Airbnb Occupancy Rate: 96%
    Peak Season: April- September

  • Athens, Greece
    Airbnb Active Listing: 11,223
    Average Airbnb Occupancy Rate: 79%
    Peak Season: June & September

  • Atlanta City, USA
    Airbnb Active Listing: 6,224
    Average Airbnb Occupancy Rate: 56 %
    Peak Season: July

  • Auckland, New Zealand
    Airbnb Active Listing: 5,026
    Average Airbnb Occupancy Rate: 77 %
    Peak Season: December

  • Austin, Texas
    Airbnb Active Listing: 10,779
    Average Airbnb Occupancy Rate: 61%
    Peak Season: April

  • Bangkok, Thailand
    Airbnb Active Listing: 14,532
    Average Airbnb Occupancy Rate: 55 %
    Peak Season: December

  • Barcelona, Spain
    Airbnb Active Listing: 13,829
    Average Airbnb Occupancy Rate: 88 %
    Peak Season: April, July & October

  • Batumi, Georgia
    Airbnb Active Listing: 4,564
    Average Airbnb Occupancy Rate: 49 %
    Peak Season: August

  • Beyoglu, Turkey
    Airbnb Active Listing:  7,891
    Average Airbnb Occupancy Rate: 61%
    Peak Season: October

  • Bogota, Colombia
    Airbnb Active Listing: 11,249
    Average Airbnb Occupancy Rate: 54 %
    Peak Season: July

  • Bordeaux, France
    Airbnb Active Listing: 4,369 
    Average Airbnb Occupancy Rate: 82%
    Peak Season: September

  • Berlin, Germany
    Airbnb Active Listing:  7,754 
    Average Airbnb Occupancy Rate: 87% 
    Peak Season: June & September

  • Brooklyn, New York
    Airbnb Active Listing: 8,858
    Average Airbnb Occupancy Rate: 79 %
    Peak Season: June

  • Budapest, Hungary
    Airbnb Active Listing:  9,741
    Average Airbnb Occupancy Rate: 79%
    Peak Season: July

  • Buenos Aires, Argentina
    Airbnb Active Listing: 24,453
    Average Airbnb Occupancy Rate: 70 %
    Peak Season: April

9 Simple Tips To Boost Your Airbnb Occupancy Rate

1. Choose the Right Airbnb Market

Finding the ideal Airbnb city or market is crucial in optimizing your occupancy rate. Look for popular destinations and analyze their Airbnb demand. These can positively affect your property’s visibility and desirability.

2. Search for the Best Submarket

Identify the most lucrative submarkets within your Airbnb city. A good Airbnb submarket includes the best neighborhoods, property types, and number of bedrooms. Targeting the specific preferences of potential guests in different areas can help you tailor your Airbnb to meet their needs and attract more bookings.

3. Add Some Amenities

Adding basic amenities such as towels, toilet paper, and wifi just meets guests’ expectations. However, going for an extra mile differentiates you from the rest. This may include adding a few small fancy Airbnb amenities, an Airbnb hot tub, or a swimming pool.

4. Furnish your Rental

Don’t skimp on quality furnishings because they will make your rental stand out. A thoughtfully designed and comfortable Airbnb is more likely to receive positive reviews and repeat bookings. Target the needs of your guests then create a welcoming environment conducive to longer stays.

5. Take Nice Photos

First impressions matter. Photos are worth a thousand words. Lure your guests with your property’s features captured in the best light. Showcase each room from different angles and center your rental’s unique aspect. While you can pick up some Airbnb photo tips, opting for a professional photographer can significantly enhance the visual appeal of your listing.

6. Boost Your Listings Visibility

Optimize your listing for Airbnb and search engine algorithms. Use relevant keywords in your title and description to target potential guests. Regular calendar updates and quick responses to guests’ inquiries also improve your search ranking.

7. Enable Airbnb Instant Book

Active Airbnb Instant Book for a seamless booking experience. This attracts spontaneous travelers. Plus, Airbnb often prioritizes and boosts the listings with this feature. 

8. Aim To Be An Airbnb Superhost

Aspire to have a Superhost status by giving exceptional hospitality. The rewards can be outstanding. These include increased visibility that can lead to higher occupancy rates and earnings.

9. Consider Professional Airbnb Managers

Consider hiring professional Airbnb managers who specialize in optimizing property listings. Aside from doing the marketing side of your rental, these experts can also handle tasks from the pricing strategy to communication with guests. You can also hire them for property upkeep and maintenance. However, these services come at a cost usually with a commission-based pricing structure. 

In the below, I’ve compiled the occupancy rates of major cities in the US, UK, Australia, and Canada. (There’s also a bonus of 50 global cities too!)  


Categories
Airbnb Occupancy All About Airbnb

Airbnb Occupancy Rate Seattle: Navigating Nightly Rate During Peak Season

Airbnb Occupancy Rate Seattle: Navigating Nightly Rate During Peak Season: Don’t know how to adjust your nightly rate during a high Seattle Airbnb Occupancy Rate? Then let granular Airbnb data analytics guide you!

airbnb occupancy rate seattle

Don’t know how to adjust your nightly rate during a high Seattle Airbnb Occupancy Rate? Then let granular Airbnb data analytics guide you!

Key Takeaways

  • During Seattle events and festivals, it can be tempting to increase your nightly rate significantly. However, overpricing your listing may result in missed booking opportunities, while underpricing could mean lost profits during high-demand periods. Striking a fair balance that benefits both you and your guests is crucial.
  • You can navigate this by learning the previous year’s Airbnb occupancy rate in Seattle and how much hosts were able to optimize their nightly rate during the city’s fun times.

Introduction

As a Seattle Airbnb host, it’s important to make the most of peak season while remaining competitive. With Seattle’s reputation for drawing large crowds from around the globe for music festivals and other events, utilizing Airbnb historical data can help you make informed pricing decisions. This way, you can adjust your rental unit accordingly like a professional Airbnb revenue manager just by using very accessible short-term rental data analytics tools!

In this blog post, we’ll highlight some of the top events in Seattle you should know to enhance your Airbnb pricing strategy this year. So whether you’re a new host or a seasoned pro, read on to discover how you can make the most of the many events that this vibrant city has to offer.

Is Seattle a good place to Airbnb?

Don’t worry, it is! Seattle has a total of 5,057 active listings with 55.25 days average booking lead time for Airbnb. This means STR units in Seattle are booked almost 2 months beforehand. 

Hosts who operate a 2-bedroom property can earn an average annual revenue of $59,561. They can charge an average nightly rate of $161 and still enjoy an average 78% occupancy rate all year round. 

Thinking of testing the Airbnb waters in Seattle while minimizing cost? Read our blog on rental arbitrage in Seattle and learn the easiest and legal way to earn passive income from real estate.

Airbnb Occupancy Rate Seattle in Peak Seasons

To outshine other Airbnb hosts the best time of year to visit Seattle, it’s crucial to stay competitive with your pricing strategy. By leveraging historical data, you can compare your prices with those of your competitors and adjust accordingly to attract more bookings. In this part, we’ll reveal how much Seattle Airbnb hosts earned during the peak season in 2022, giving you insights on how much you can earn this year.

With its cutting-edge feature, Airbtics offers another tool that enables you to analyze daily, weekly, and monthly data comprehensively for more granular analysis. Include the ever-reliable Custom Market feature, you can check the average nightly rate and other essential data from various Seattle Airbnb markets catering to tourists during city festivities.

1. Capitol Hill Block Party
  • Airbnb Market: Capitol Hill
  • When: July 22 – 24, 2022
  • Average Occupancy Rate: 32.33%
  • Average Booking Lead Time: 90.33 Days
  • Average Nightly Rate: $260.67
2. Seattle International Film Festival
  • Airbnb Market: Columbia City
  • When: April 14 – 24, 2022
  • Average Occupancy Rate: 24.2%
  • Average Booking Lead Time: 40.55 Days
  • Average Nightly Rate: $123.18
3. Bite of Seattle 
  • Airbnb Market: Seattle Center Area
  • When: August 5 – 7, 2022
  • Average Occupancy Rate: 33.3%
  • Average Booking Lead Time: 102 Days
  • Average Nightly Rate: $151.33
4. Seattle Pride
  • Airbnb Market: Downtown, Seattle
  • When: June 4
  • Average Occupancy Rate: 31.6%
  • Average Booking Lead Time: 66 Days
  • Average Nightly Rate: $201
5. Seattle Hempfest
  • Airbnb Market: Downtown, Seattle
  • When: June 4
  • Average Occupancy Rate: 32.6%
  • Average Booking Lead Time: 57 Days
  • Average Nightly Rate: $171

Conclusion

During Seattle events and festivals, it can be tempting to increase your nightly rate significantly. However, overpricing your listing may result in missed booking opportunities, while underpricing could mean lost profits during high-demand periods. Striking a fair balance that benefits both you and your guests is crucial.

To achieve this balance, you need to conduct thorough research and analyze market demand in detail using granular data offered by the game-changing data analytics tool, Airbtics. This allows you to price your Airbnb listing competitively, attracting guests while maintaining a reasonable profit margin. Hence, researching the occupancy rates of key cities in the US is a smart way to start your investment journey. This way, you will have a better overview of the market you want to target.

Ensure that you’re pricing your STR unit correctly with our accurate and user-friendly Airbnb Profit Calculator. Check it out now!

Have The Bird’s-Eye View then
Plunge into the Granular Data of Seattle Airbnb Market

Unlock Worldwide
Short-Term Rental Data
Find unsaturated neighborhoods with the highest occupancy history.

Unlock Worldwide
Short-Term Rental Data
Find unsaturated neighborhoods with the highest occupancy history.

Annual Airbnb Revenue in Citrus heights california, USA

Citrus Heights, California| Airbnb Market Data & Overview | USA Citrus Heights, California Airbnb Market Data & Overview USA Is it profitable to do Airbnb …

Read More →
Annual Airbnb Revenue In Istanbul Turkey

Istanbul| Airbnb Market Data & Overview | Turkey Istanbul Airbnb Market Data & OverviewTurkey Is it profitable to do Airbnb in Istanbul, Turkey? What is …

Read More →
Annual Airbnb Revenue in Fremont california, USA

Fremont, California| Airbnb Market Data & Overview | USA Fremont, California Airbnb Market Data & Overview USA Is it profitable to do Airbnb in Fremont, …

Read More →
Reglas Airbnb en Toledo

Si es que deseas comprar inversiones inmobiliarias en España, el primer paso que debes realizar es conocer más a fondo las reglas de Airbnb! En …

Read More →
Annual Airbnb Revenue in Bourne massachusetts, USA

Bourne, Massachusetts| Airbnb Market Data & Overview | USA Bourne, Massachusetts Airbnb Market Data & Overview USA Is it profitable to do Airbnb in Bourne, …

Read More →
Annual Airbnb Revenue in Midlothian virginia, USA

Midlothian, Virginia| Airbnb Market Data & Overview | USA Midlothian, Virginia Airbnb Market Data & Overview USA Is it profitable to do Airbnb in Midlothian, …

Read More →

Categories
Airbnb Occupancy All About Airbnb

Orlando Airbnb Occupancy Rate: Top Events Every Airbnb Host Should Know

orlando airbnb occupancy rate

Key Takeaways
  • Orlando Airbnb occupancy rate fluctuates as events happen. The challenge for Airbnb hosts is the strategic pricing of their short-term rental units during peak season. The good news is Airbnb historical data can guide them to maximize their profits during peak seasons.

Introduction

Orlando, Florida is a world-famous destination for its theme parks, beautiful weather, and countless attractions. As an Airbnb host in this exciting city, it’s important to stay informed about the top Orlando Florida events to help you stand out in its highly competitive short-term rental market.

In this blog post, we’ll highlight some of the top events in Orlando you should know to up your Airbnb pricing strategy. So whether you’re a new host or a seasoned pro, read on to discover how you can make the most of the many events that this vibrant city has to offer.

Is Orlando a good city for Airbnb?

Definitely yes! Airbnb hosts who operate a 2-bedroom property earn an average of $43,072 in annual revenue from the 72% occupancy rate. The average booking lead time in Orlando is 44 days, so you are ensured that your property will be booked more than one and a half months in advance. The average nightly rate for the said property size is $144

We get it – the numbers are enticing. Interested to be an Airbnb host in the city? Make sure to know the airbnb rules in Orlando. But if capital hinders you to be a host, there’s rental arbitrage – an affordable and completely legal way to start an Airbnb. And lastly, If you plan to expand your rental market portfolio in the city, check out the profitable locations for Airbnb in Orlando.

Top Orlando Events Every Airbnb Host Should Know

All Airbnb hosts in Orlando definitely know the following events. But strategic pricing during Orlando’s peak season is what they may be missing out on. The good news is historical data can help hosts guide them to maximize their profits during peak seasons. 

Below are some of the top events in Orlando and how much Airbnb hosts cashed in during these peak seasons, as confirmed by Airbtics’ Granular Data Feature.

1. Orlando Fringe
  • Attendees: 48,000
  • Where: Loch Haven Park
  • When: June 3 – 17, 2022
    • Booking Lead Time: 21 days
    • Occupancy Rate: 30%
    • Average Nightly Rate: $145.5
2. Fiesta in the Park
  • Attendees: 150,000
  • Where: Downtown Orlando
  • When: April 1 & 2, 2022
    • Booking Lead Time: 57 days
    • Occupancy Rate: 14.9%
    • Average Nightly Rate: $218.5
3. Orlando Film Festival
  • Attendees: 12,000
  • Where: Downtown Orlando
  • When: July 9-15, 2022
    • Booking Lead Time: 45 days
    • Occupancy Rate: 10%
    • Average Nightly Rate: $185 
4. Megacon Orlando
  • Attendees: 140,000
  • Where: International Drive Area
  • When: May 19 – 22, 2022
    • Booking Lead Time: 40 days
    • Occupancy Rate: 18.2%
    • Average Nightly Rate: $279
5. Central Florida Fair
  • Attendees: 200,000
  • Where: West Colonial Drive Area
  • When: March 3-13, 2022
    • Booking Lead Time: 14 days
    • Occupancy Rate: 35%
    • Average Nightly Rate: $104

Conclusion

While it’s tempting to raise your prices significantly during high Orlando vacation rental occupancy rate periods, it’s important to keep in mind this dilemma. Overpricing your listing can lead to missed booking opportunities. On the other hand, pricing too low may mean missing out on potential profits during high-demand periods. 

The key is to strike a balance that is fair to both you and your guests. By doing some research and analyzing the market demand on a granular level, you can price your Airbnb listing competitively and attract guests while also ensuring a reasonable profit margin.

Are you pricing your STR unit right? Then see for yourself using this accurate and accessible Airbnb Profit Calculator.

Bird’s-Eye View then Dive into the Granular Data of Orlando Airbnb Market!

Categories
Airbnb Occupancy All About Airbnb

Top Events and Airbnb Occupancy Rate in Toronto

Airbnb occupancy rate in toronto

Key Takeaways
  • Enhance your Toronto Airbnb hosting experience by leveraging the insights on Airbnb occupancy rate in Toronto! By understanding the average daily rate and booking lead times for major Toronto events, you can align your pricing strategy to attract more guests, increase Airbnb occupancy rate, and maximize your profitability.

Introduction

Toronto, Ontario, Canada is renowned for its vibrant tapestry of culture, cuisines, and traditions. The city’s multiculturalism and diversity are evident in the array of events Toronto offers throughout the year. Toronto is also a major economic hub, attracting businesses and industries from around the world. The city’s event calendar is filled with an abundance of options that residents and tourists alike can immerse themselves in the cultural fabric of Toronto.

In this blog post, we delve into Airbnb occupancy rate in Toronto, Airbnb pricing strategy, and essential insights on Toronto events to help hosts stand out in the highly competitive short-term rental market.

Is the Airbnb business profitable in Toronto?

A Toronto Airbnb business is definitely profitable! Earn C$42,618 in annual revenue with a 50% occupancy rate for 1-bedroom rentals. With an average booking lead time of 40 days and an average daily rate of C$117, your property is set to thrive in the bustling Toronto short-term rental scene.

Toronto’s lively cultural scene, major events, and diverse attractions attract a steady stream of tourists throughout the year. By capitalizing on this demand, Airbnb hosts have the potential to earn said substantial revenue. Hosts can strategically plan their pricing by considering factors such as the average booking lead time of 40 days and the average daily rate of C$117.

With the city’s vibrant and diverse atmosphere, combined with these enticing figures, we sure get the appeal. Hosting an Airbnb in Toronto is an irresistible venture and provides promising financial prospects for those seeking financial successes in the short-term rental market. 

If you plan to be a host in the city, familiarize yourself with the essential Airbnb rules in Toronto to ensure a smooth and compliant hosting experience. Discover the potential of rental arbitrage to overcome capital constraints and profit from the price difference between leasing a property and subleasing it on a platform, unlocking new opportunities for passive income generation.

Toronto Events Airbnb Hosts Should Take Not Of

As an Airbnb host, staying informed about these Toronto events is crucial for refining your Airbnb pricing strategy and maximizing your earning. In this comprehensive guide, we highlight the top Toronto events that every Airbnb host should take note of.

Discover how aligning your pricing with these events can attract more guests, increase airbnb occupancy rate in Toronto, and ultimately boost your profitability. From film and music festivals to comics and gaming events, these insights from our historical data will empower you to optimize your Airbnb pricing strategy and stay ahead of the competition.

1. Toronto International Film Festival
  • Attendees: 250, 000+
  • Where: TIFF Bell Lightbox, Downtown Toronto
  • When: September 9 – September 18, 2022
    • Occupancy Rate: 19.75%
    • Average Daily Rate: C$116.84
    • Booking Lead: 58 days

The Toronto International Film Festival (TIFF) evidently takes the spotlight as a major event that significantly impacts Airbnb occupancy rate in Toronto. With over 250,000 attendees, TIFF attracts a massive influx of visitors to Downtown Toronto, particularly around the TIFF Bell Lightbox venue. 

As an Airbnb host, this event presents an incredible opportunity to capitalize on the surge in demand. It’s crucial to plan ahead as the booking lead time for TIFF is around 58 days, allowing hosts to strategically set their pricing and optimize their listing to attract festival attendees seeking accommodations.

2. Fan Expo Toronto
  • Attendees: 140, 000+
  • Where: Metro Toronto Convention Centre
  • When: August 25 – 28, 2022
    • Occupancy Rate: 21.98%
    • Average Daily Rate: C$121.62
    • Booking Lead: 65 days

Fan Expo Toronto also emerges as a prominent event with a significant impact on Airbnb occupancy rate in Toronto. Drawing in more than 140,000 enthusiastic attendees, this event takes place at the Metro Toronto Convention Centre. 

Hosts can leverage this surge in demand to secure bookings and generate higher revenue. The average daily rate for Airbnb listings during Fan Expo Toronto is approximately C$121.62, offering hosts the potential for profitable returns. 

3. Toronto Comic Con
  • Attendees: 130, 000+
  • Where: Metro Toronto Convention Centre
  • When: March 18 – March 20, 2022
    • Occupancy Rate: 21.97%
    • Average Daily Rate: C$91.83
    • Booking Lead: 23 days

As an Airbnb host in Toronto, knowing about the high occupancy rate and demand during events like Toronto Comic Con can help you optimize your hosting strategy. With over 130,000 attendees, Toronto Comic Con brings a significant influx of visitors to the Metro Toronto Convention Centre. With an occupancy rate of 21.97%, this event presents a prime opportunity to attract guests and maximize your bookings. 

4. OktoberFest Toronto
  • Attendees: 40, 000
  • Where: Ontario Place, Lakeshore Blvd
  • When: September 30 – October 2, 2022
    • Occupancy Rate: 20.9%
    • Average Daily Rate: C$121.62
    • Booking Lead: 52 days

OktoberFest Toronto draws in 40,000 attendees, creating a surge in visitors at Ontario Place on Lakeshore Blvd. This event takes place from September 30 to October 2, 2022, with an occupancy rate of 20.9%. 

Armed with this valuable information, you can strategically adjust your pricing and availability to make the most of the increased demand during this period. 

5. Santa Claus Parade Toronto
  • Attendees: 500, 000
  • Where: Christie Prits along Bloor Street West to Front Street West
  • When: November 2, 2022
    • Occupancy Rate: 17.2%
    • Average Daily Rate: C$107.39
    • Booking Lead: 56 days

With a staggering 500,000 attendees, the Santa Claus Parade in Toronto is a massive one-day event that spans along Bloor Street West to Front Street West, attracting a significant influx of visitors. Taking place on November 2, 2022, the Santa Claus Parade exhibits an occupancy rate of 17.2%. 

Armed with this knowledge, you can strategically adjust your pricing and availability to capitalize on the increased demand during this festive period. Setting your average daily rate around C$107.39 enables you to offer competitive pricing and potentially generate higher revenue from your Airbnb listing. 

Given the 56-day booking lead time, it is crucial to plan ahead and optimize your listing, emphasizing its proximity to the parade route and creating a warm and inviting atmosphere to entice Santa Claus Parade attendees seeking convenient accommodations. 

Conclusion

It is evident that Toronto provides abundant opportunities for maximizing your Airbnb hosting experience, with the knowledge of key factors such as the Airbnb occupancy rate in Toronto. By leveraging the insights provided, including occupancy rate, average daily rate, and booking lead times for major Toronto events, you can fine-tune your Airbnb pricing strategy to attract more guests and boost your profitability.

Understanding the Airbnb occupancy rate in Canada allows hosts to gauge the demand for accommodations during specific events or periods in their target city. By identifying peak occupancy periods, hosts can adjust their pricing accordingly to capitalize on the increased demand and maximize their booking potential.

Being aware of the daily rate prevalent during these events will also provide hosts with a benchmark for setting competitive prices that appeal to potential guests while still ensuring profitability. Indeed, by staying proactive in adjusting their pricing strategy for Airbnb occupancy rate in Toronto based on the provided insights, hosts can position themselves for success. 

Whether it’s the prestigious Toronto International Film Festival, the exhilarating Fan Expo Toronto, or the festive OktoberFest Toronto, aligning your pricing with these events can make a significant impact on your Airbnb business. Stay ahead of the competition, optimize your earnings, and enjoy success in the vibrant world of Toronto vacation rentals.

Ensure accurate pricing for your STR unit by utilizing Airbnb Profit Calculator, a user-friendly tool, allowing you to determine if you are setting the right price!

Explore The Most Profitable Airbnb Locations in Toronto, Canada

Airbnb occupancy rate in toronto
Categories
Airbnb Occupancy All About Airbnb Case Studies

NYC Airbnb Occupancy Rate: Top Events Airbnb Hosts Should Know

 nyc airbnb occupancy rate

Key Takeaway
  • Learn how much the NYC Airbnb occupancy rate fluctuates when major events are happening.
  • This article offers valuable New York real investing information on how much you can adjust the nightly rate of your short-term rental property.

Introduction

They say, “if you can make it here, you can make it anywhere.” But you’re already in New York and can do better in its Airbnb market by using short-term rental data analytics. In this blog, we will talk about events in New York that draw more than the usual number of guests for your Airbnb rentals!

Can you do short-term rentals in New York City?

With proper registration, short-term rentals are allowed in New York City. The local government also compels you to share your hosting and listing data. You can decide not to do so. However, you can only host a tenant for at least 30 days. Complaints can be easily submitted. So, make sure that you follow the local regulations regarding short-term rentals. 

How profitable is Airbnb in NYC?

New York City currently has 8,844 listings. An NYC host with a 2-bedroom Airbnb unit can charge an average nightly rate of $189. The said property size brings in $62,810 annual revenue with a staggering occupancy rate of 89%.

Top NYC Events Every Airbnb Host Should Know

Tourists from every part of the world come to New York City throughout the year. But there are just events that make spikes in the number of visitors. Using the Airbtics Dashboard, we can know how much Airbnb hosts in various New York real estate markets earn during the months of major events:

1. St Patrick’s Day
  • Attendees: 150,000 people
  • When: March
  • Area: Midtown Manhattan
    • Best Property size: 2 bedrooms
    • March Occupancy Rate: 100%
    • March Revenue: $7,377
    • March Nightly Rate: $277
    • Airbnb annual revenue: $111,038
    • Average occupancy rate: 92%
2. Tribeca Film Festival
  • Attendees: 150,000 people
  • When: June
  • Area: Lower Manhattan
    • Best Property size: 3 bedrooms
    • June Occupancy Rate: 100%
    • June Revenue: $24,188
    • June Nightly Rate: $762
    • Airbnb annual revenue: $219,387
    • Average occupancy rate: 89%
3. National Puerto Rican Day
  • Attendees: 1.5 Million
  • When: June
  • Area: Midtown Manhattan
    • Best Property size: 2 bedrooms
    • June Occupancy Rate: 100%
    • June Revenue: $11,564
    • June Nightly Rate: $384
    • Airbnb annual revenue: $111,038
    • Average occupancy rate: 92%
4. NYC Pride Parade
  • Attendees: 2.1 Million
  • When: June
  • Area: Lower Manhattan
    • Best Property size: 3 bedrooms
    • June Occupancy Rate: 100%
    • June Revenue: $24,188
    • June Nightly Rate: $762
    • Airbnb annual revenue: $219,387
    • Average occupancy rate: 89%
5. US Open
  • Attendees: 700,000+
  • When: August
  • Area: Flushing
    • Best Property size: 2 bedrooms 
    • August Occupancy Rate: 89%
    • August Revenue: $5,135
    • August Nightly Rate: $197
    • Airbnb annual revenue: $50,282
    • Average occupancy rate: 77%
6. New York Comic Con
  • Attendees: 200,000
  • When: October
  • Area: West Side
    • Best Property size: 2 bedrooms
    • October Occupancy Rate: 100%
    • October Revenue: $9,302
    • October Nightly Rate: $345
    • Airbnb annual revenue: $110,944
    • Average occupancy rate: 88%
7. Village Halloween Parade
  • Attendees: 50,000 – 60,000
  • When: October
  • Area: Midtown Manhattan
    • Best Property size: 2 bedrooms
    • October Occupancy Rate: 100%
    • October Revenue: $10,382
    • October Nightly Rate: $380
    • Airbnb annual revenue: $111,038
    • Average occupancy rate: 92%
8. New York International Auto Show
  • Attendees: 1 Million people
  • When: April
  • Area: Midtown Manhattan
    • Best Property size: 2 bedrooms
    • April Occupancy Rate: 100%
    • April Revenue: $9,906
    • April Nightly Rate: $334
    • Airbnb annual revenue: $111,038
    • Average occupancy rate: 92%

Conclusion

Buying property in NYC began has cost you a lot of money. So, it’s important to not leave money on the table should you decide to Airbnb your New York property. Part of this is adjusting your nightly rate without losing the number of bookings. And as we have learned, you can definitely do that with the help of short-term rental data analytics. You can start exploring what it can do for you by trying this Airbnb Profit Calculator for free!

On the other hand, you can research more profitable markets with the help of reliable analytics tools such as Airbtics. By doing so, you can also discover the average Airbnb occupancy rate in other cities, their annual revenue and much more!

Monitor Your Market & Have An Empire State of Returns!

nyc airbnb occupancy rate
Categories
Airbnb Occupancy All About Airbnb

Washington DC Airbnb Occupancy Rate and Best Areas for Real Estate Investments

washington dc airbnb occupancy rate

Key Takeaways

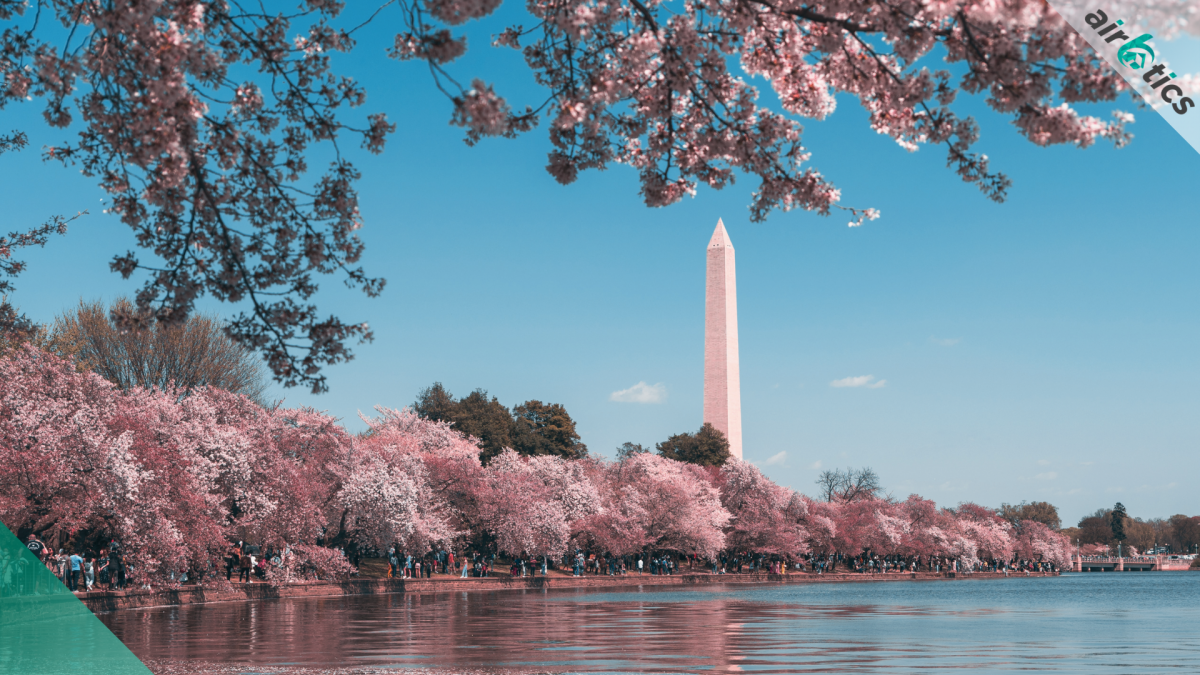
The National Cherry Blossom Festival is the biggest spring event in DC. It is an annual event attracting 700,000 visitors who wish to witness the blossoming of over 3,000 cherry trees. 

●  Short-term rental data analytics informs us that while the event is a magnet of close to a million spectators from outside the DC area, Airbnb revenue is just starting to climb up from there.

Introduction:

Washington DC is not all about politics. Residents also know how to have fun by celebrating numerous festivals. And part of this fun for Airbnb hosts is enjoying high rental earnings during the peak season in Washington DC!

In this article, we will take a look at the Washington DC Airbnb occupancy rates throughout the year. It will also include a heads-up for Airbnb hosts to expect the seasonality where their revenue can potentially spike.

Florida Property Investment Markets

 Is Airbnb profitable in Washington DC?

Airbtics’ Dashboard confirms that Airbnb is indeed profitable in Washington DC. A one-bedroom property can rest assured of a staggering 72% occupancy rate, which can bring in annual revenue of $42,407.

If you wish to test the Washington DC Airbnb market first, check how rental arbitrage can allow you to do so. Why not try it out during the upcoming festivals? You will be surprised to know that lucrative side hustle has been readily available for a long time!

washington dc airbnb occupancy rate

Spring 2023 Events in Washington DC

The National Cherry Blossom Festival is the biggest spring event in DC. It is an annual spectacle attracting 700,000 visitors who wish to witness the blossoming of over 3,000 cherry trees. These trees were gifts of Tokyo Mayor Yukio Ozaki to DC in 1912. Running from March 18 to April 16, this festival is a celebration of friendship between these two nations. 

Coinciding this month-long celebration, here are the other big events happening in the US capitol this Spring 2023:

Japanese Street Festival – Japanese culture takes center stage in this 24-hour, 2-day street festivity. Expect a lot of Japanese cultural performances as authentic food, beverages, and handicrafts from the Land of the Rising Sun overflow 3rd to 7th streets NW on Pennsylvania Avenue. This event will take place on April 15 to 16. 

FilmFest DC – Watching movies at theaters is a communal experience. And this year, Washington’s biggest and long-enduring film festival returns after a hiatus due to the pandemic! See the best of world cinema to come to DC on April 19 to 30. This film festival will feature 65 films from 30 countries over the course of its 12-day run. 

Profitable Airbnb Areas in Washington DC

We have learned the potential earnings of an investment property in Washington DC. The best thing about the National Cherry Blossom Festival is attracting hundreds of thousands of tourists every year and being enjoyed anywhere in the DC Area.

Aibtics Dashboard gives us the top 3 areas for an Airbnb Investment in DC.

1. Georgetown

Georgetown is the top DC neighborhood for an Airbnb investment. In fact, the 79% occupancy rate for a 2-bedroom property in the area is higher than the average occupancy rate of the entire DC. This type of property gives a steady annual income of $72,755. In connection with the DC events happening in April, Airbtics Dashboard confirms that this is its peak month – when hosts can expect more than 10% of the annual revenue in just a single month.

washington dc airbnb occupancy rate
2. Capitol Hill

It’s not surprising to see Arbtics Discovery Tool includes the Capitol Hill area as one of the top places in DC for Airbnb. But the value the tool adds is getting the average occupancy rate of a one-bedroom apartment in the area. Furthermore, an Airbnb host owning this type of real estate can earn around $54,436 yearly. Notice that while March is not the area’s peak season, the monthly revenue is only beginning to rise.

washington dc airbnb occupancy rate
3. Capitol Riverfront

The third best place for an Airbnb investment has 61 Airbnb listings with an average occupancy rate of 54%. While the trend is also projecting upward, monthly revenue can nosedive starting from the month of July. Still, hosts can expect an annual revenue $41,835

washington

Is Airbnb legal in Washington DC?

Yea, Airbnb is certainly legal in Washington DC! Hosts planning to have an investment property in Washington DC should first apply for a Short-Term or Vacation Rental License to kick off their Airbnb. 

In a short-term rental, the host should also be on the same property, which has a spare bedroom for their Airbnb guests. Only the presence of the host differentiates a short-term rental from a vacation rental, as defined by the local government of the District of Columbia.

Conclusion

In this article, we have learned about the best Airbnb neighborhoods in Washington DC. Not only that, we have learned how short-term rental data analytics can guide us in making the best investment decisions that would lead us to the most favorable financial outcomes.

Just like in politics, be strategic in your real estate investment. Start with this free Airbnb profit estimator to see where you’re at in your real estate game!

Explore The Most Profitable Airbnb Locations in Washington DC

Categories
Airbnb Occupancy All About Airbnb

Chicago Airbnb Occupancy Rate and Best Neighborhoods to Invest

Chicago Airbnb Occupancy Rate

Key Takeaways

Chicago is among the major US cities, making it a profitable market in any field, including short-term rentals. In fact, a two-bedroom Chicago investment property can earn an average annual income of $45,221.  

♦ Get insider Chicago real estate investing leads with the help of short-term rental data analytics. This article will provide insights into the average Chicago Airbnb occupancy rate as well as the peak season in its investment property market.

Introduction:

Chicago is home to major global companies. This fact alone already makes it an ideal place for any type of investment. But let’s talk about the viability of the Chicago property market. What are the key indicators that need to be discussed? And how can hosts and investors benefit from short-term rental data analytics

In this article, we will find out the local Airbnb occupancy rate throughout the year and when can Chicago real estate investors expect a spike in occupancy and revenue. This answers the question of whether or not Chicago is a profitable short-term rental market.

Is Chicago good for rental investment?

Chicago is indeed a good place for a rental investment like an Airbnb. It is among the top destinations of millions of tourists from around the world. In fact, the numbers also confirm Airbnb’s profitability in the city. According to Airbtics, the 2,596 local Airbnb listings have an average occupancy rate of 69%. With this, hosts can expect around $36,598 in annual revenue.

Chicago Airbnb Occupancy Rate

Is Chicago a good place to start an Airbnb? 

You do not have to spend a fortune to gain a bigger one in Chicago real estate. In fact, you can try out the local Airbnb market without actually buying a property investment via rental arbitrage. Of course, you still need some preparation in order to make money. And once you’ve learned the ins and outs of rental arbitrage in Chicago, it is best to know the upcoming events that guarantee high occupancy rates:

1. Shamrock Shuffle
  • When:  March 26, 2023
  • Where: Chicago’s Loop
  • Last year’s participants: 32,000
2. Chicago Comic & Entertainment Expo
  • When: March 31 – April 2, 2023
  • Where: McCormick
  • Last year’s participants: 90,000
3. Chicago Blues Festival
  • When: June 8 – 11, 2023
  • Where: Millennium Park
  • Last year’s participants: 500,000
4. Chicago Annual Pride Fest
  • When: June 17 – 18, 2023
  • Where: Waveland Avenue
  • Last year’s participants: 1M+
5. Lollapalooza
  • When: August 3 -6, 2023
  • Where: Grant Park
  • Last year’s participants: 1M+

These events drove the occupancy rate of Airbnb properties in Chicago last year, and even Airbnb confirms this. By using the Airbtics Dashboard, we can see that the 70% median occupancy rate in March peaked at 100% in July. At its peak, the average revenue was $4,781.

What are the best neighborhoods in Chicago for Airbnb?

Using Airbtics’ Custom Market feature, we can zoom into an Airbnb market and study its key metrics. In Chicago Airbnb neighborhoods, the following areas are the best places for a short-term rental investment:

1. Lincoln Park
  • Existing Airbnb listings: 235
  • Average daily rate: $205
  • Airbnb occupancy rate: 71%
  • Airbnb annual revenue: $56,980
  • Best property size: 2 bedrooms
    • Occupancy rate: 75%
    • Annual revenue: $69,908
2. Wicker Park 
  • Existing Airbnb listings: 153
  • Average daily rate: $194
  • Airbnb occupancy rate: 69%
  • Airbnb annual revenue: $52,446
  • Best property size: 2 bedrooms
    • Annual revenue: $54,007
    • Occupancy rate: 79%
3. Logan Square
  • Existing Airbnb listings: 292
  • Average daily rate: $135
  • Airbnb occupancy rate: 74%
  • Airbnb annual revenue: $41,131
  • Best property size: 2 bedrooms
  • Annual revenue: $44,880
  • Occupancy rate: 77%

Conclusion:

It is a no-brainer that investing in real estate in Chicago is indeed a wise decision. The city is a profitable Airbnb market all year round because of the tourists who come in and need accommodation. While tourism is already strong in Chicago, hosts can expect higher profits beginning in March due to the world-renowned spring events in the city.

In this article, we have learned the key metrics that can inform hosts and investors as they navigate the local property market. All this is possible with the help of short-term rental data analytics. With this, we are able to find out the average occupancy rate, annual revenue, and the best property size that gives the optimal profit. 

Now that you know the benefits of using short-term rental data, try this Airbnb profit calculator for free and maximize your revenue potential. 

Explore The Most Profitable Airbnb Locations in Chicago and Nearby Cities

Categories
Airbnb Occupancy All About Airbnb

Airbnb Occupancy Rates in France: Top 20 Cities for Aibnb Investment

airbnb occupancy rates France

France owns an immense cultural & historical legacy, beautiful landmarks and exquisite cuisine that is praised all around the world. Therefore, it’s understandable that this country is one of the most visited countries in the world!

Whether you are aiming to go to historic towns or places surrounded by stunning natural landscapes, France will always have something prepared for you. All French cities are captivating and there’s always something new to discover. Plus you can enjoy the French culture while tasting a delicious glass of the best wine.

Yet, before buying an Airbnb property investment in France, you need to analyze which city to target and determine the profitability based on Airbnb’s important key metrics. 

In this article, you will find the top 20 best cities for Airbnb in France along with their respective occupancy rates, monthly & yearly revenue, average daily rates (ADRs), and more. Stoked to learn more? Then continue reading!

Why Invest in an Airbnb Property in France?

airbnb occupancy rates France

The dreamy cities in France and their exciting attractions are famous in all corners of the world. Along with a long and interesting history, this country is usually on everyone’s wish list. But what advantages does this country have for investors? Here are the top reasons why you should invest in an Airbnb property in France:

  • The most visited country in the world

No one ranks higher than France in terms of tourism since it’s one of the most visited countries in the world! As a matter of fact, just in 2020, France welcomed around 117M international tourist arrivals and the tourism industry contributes around 211 billion euros to French GDP. This surely sounds fascinating to investors who are looking to cater to tourist accommodations in this country.

  • France is one of the major economic powers worldwide

France is also a major economic power that ranks high alongside other countries such as Italy, the USA, the UK and Germany. Currently, this country owns the 7th place as the world’s largest economy and Europe’s third-largest economy as confirmed by the International Trade Administration

  • Short-term rental investment profitability in France

If you are wondering whether  France is a profitable market to invest in, then let me mitigate your doubts – this city is highly profitable! On top of that, you can expect high occupancy rates in your Airbnb listings in almost any city in France, but especially if you choose Paris since this is one of the fully booked Airbnb cities along with Barcelona, Riga and Brighton. 

In Paris, an Airbnb host can earn up to €42,295 annually with an average occupancy rate of 93%.

Is Airbnb legal in France?

While knowing Airbnb’s key metrics is important, it’s also essential to consider if short-term rentals are legal in the city you want to invest in or not. Now, let’s get straight to the point –  Airbnb is legal in France. 

Each city in France has its own regulations for short-term rentals, thus, it’s always important to check out their specific Airbnb Rules in France.

For example, to operate a short-term rental in France, you must register your listing first. Yet, you won’t be required to register your listing if this is a “bail mobilité” (mobility lease), a room in your primary residence, or a bed and breakfast (chambre d’hôtes).

Airbnb Occupancy Rates in France – Top 20 Cities

France offers lucrative investment opportunities, hence, it’s not a surprise that this country has drawn property investors’ attention. But there are still major doubts: where you should do a real estate investment in France? Should you invest in Airbnb in cities in France like Nantes or Provence?

To figure out the best cities to do short-term rental investments in France, we used Airbtics’ estimator and filtered them by 2-bedroom properties to find out the top 20 markets with the highest occupancy rates:

1. Paris
  • Total Number of Airbnb Listings: 10,639
  • Airbnb Annual Revenue: €69,446
  • Average Daily Rate: €212
  • Occupancy Rate: 93%
  • Median Property Price (2-bedroom): €550,000
  • Gross Rental Yield: 12.6%
2. Versailles
  • Total Number of Airbnb Listings: 336
  • Airbnb Annual Revenue: €44,377
  • Average Daily Rate: €138
  • Occupancy Rate: 86%
  • Median Property Price (2-bedroom): €550,000
  • Gross Rental Yield: 8.0%
3. Nantes 
  • Total Number of Airbnb Listings: 1,568
  • Airbnb Annual Revenue: €28,001
  • Average Daily Rate: €91
  • Occupancy Rate: 84%
  • Median Property Price (2-bedroom): €259,500
  • Gross Rental Yield:%
4. Lyon
  • Total Number of Airbnb Listings: 3,699
  • Airbnb Annual Revenue: €35,491
  • Average Daily Rate: €122
  • Occupancy Rate: 81%
  • Median Property Price (2-bedroom): €315,000
  • Gross Rental Yield: 10.8%
5. Strasbourg
  • Total Number of Airbnb Listings: 1,517
  • Airbnb Annual Revenue: €33,932
  • Average Daily Rate: €115
  • Occupancy Rate: 80%
  • Median Property Price (2-bedroom): €275,000
  • Gross Rental Yield: 12.3%
6. Lille
  • Total Number of Airbnb Listings: 1,449
  • Airbnb Annual Revenue: €32,020
  • Average Daily Rate: €101
  • Occupancy Rate: 79%
  • Median Property Price (2-bedroom): €279,000
  • Gross Rental Yield: 11.4%
7. Montpellier
  • Total Number of Airbnb Listings: 2,532
  • Airbnb Annual Revenue: €27,997
  • Average Daily Rate: €95
  • Occupancy Rate: 79%
  • Median Property Price (2-bedroom): €249,000
  • Gross Rental Yield: 11.2%
8. Bordeaux
  • Total Number of Airbnb Listings: 2,462
  • Airbnb Annual Revenue: €25,589
  • Average Daily Rate: €91
  • Occupancy Rate: 79%
  • Median Property Price (2-bedroom): €315,000
  • Gross Rental Yield: 8.1%
9. Toulouse
  • Total Number of Airbnb Listings: 2,439
  • Airbnb Annual Revenue: €24,972
  • Average Daily Rate: €85
  • Occupancy Rate: 78%
  • Median Property Price (2-bedroom): €174,000
  • Gross Rental Yield: 14.4%
10. Aix-en-Provence
  • Total Number of Airbnb Listings: 1,457
  • Airbnb Annual Revenue: €32,795
  • Average Daily Rate: €118
  • Occupancy Rate: 78%
  • Median Property Price (2-bedroom): €350,000
  • Gross Rental Yield: 9.4%
11. Nice
  • Total Number of Airbnb Listings: 6,366
  • Airbnb Annual Revenue: €43,156
  • Average Daily Rate: €142
  • Occupancy Rate: 75%
  • Median Property Price (2-bedroom): €330,000
  • Gross Rental Yield: 13.1%
12. Marseille
  • Total Number of Airbnb Listings: 5,833
  • Airbnb Annual Revenue: €27,356
  • Average Daily Rate: €103
  • Occupancy Rate: 69%
  • Median Property Price (2-bedroom): €159,000
  • Gross Rental Yield: 17.2%
13. Annecy
  • Total Number of Airbnb Listings: 1,525
  • Airbnb Annual Revenue: €33,317
  • Average Daily Rate: €138
  • Occupancy Rate: 64%
  • Median Property Price (2-bedroom): €339,900
  • Gross Rental Yield: 9.8%
14. St Malo
  • Total Number of Airbnb Listings: 1,473
  • Airbnb Annual Revenue: €26,940
  • Average Daily Rate: €110
  • Occupancy Rate: 64%
  • Median Property Price (2-bedroom): €350,000
  • Gross Rental Yield: 7.7%
15. La Rochelle
  • Total Number of Airbnb Listings: 2,266
  • Airbnb Annual Revenue: €25,206
  • Average Daily Rate: €109
  • Occupancy Rate: 59%
  • Median Property Price  (2-bedroom): €350,000
  • Gross Rental Yield: 7.2%
16. Antibes
  • Total Number of Airbnb Listings: 2,266
  • Airbnb Annual Revenue: €31,602
  • Average Daily Rate: €134
  • Occupancy Rate: 57%
  • Median Property Price (2-bedroom): €378,000
  • Gross Rental Yield: 8.4%
17. Avignon
  • Total Number of Airbnb Listings: 1,896
  • Airbnb Annual Revenue: €20,156
  • Average Daily Rate: €100
  • Occupancy Rate: 52%
  • Median Property Price (2-bedroom): €173,000
  • Gross Rental Yield: 11.7%
18. Chamonix-Mont-Blanc
  • Total Number of Airbnb Listings: 1,906
  • Airbnb Annual Revenue: €33,454
  • Average Daily Rate: €164
  • Occupancy Rate: 51%
  • Median Property Price (2-bedroom): €595,000
  • Gross Rental Yield: 5.6%
19. Biarritz
  • Total Number of Airbnb Listings: 2,160
  • Airbnb Annual Revenue: €28,136
  • Average Daily Rate: €139
  • Occupancy Rate: 50%
  • Median Property Price (2-bedroom): €570,000
  • Gross Rental Yield: 4.9%
20. Saint Tropez
  • Total Number of Airbnb Listings: 530
  • Airbnb Annual Revenue: €52,083
  • Average Daily Rate: €305
  • Occupancy Rate: 43%
  • Median Property Price (2-bedroom): €570,000
  • Gross Rental Yield: 9.1%

Summary

We can’t deny that France is a charming country that opens the doors to endless exciting experiences, but not only that – it also offers fascinating opportunities to property investors. On top of that, most cities in France are considered profitable for Airbnb property investments thanks to their high revenue and occupancy rates!

While there are many lucrative cities in France, there’s always a risk if you decide to invest in a market before analyzing the important metrics. Thus, it’s always recommended to conduct market research using short-term rental analytics tools like Airbtics.

Take the advantage of living in the digital era and use a short-term rental estimator to discover your market’s profitability and stand out among your competitors!

Categories
Airbnb Investment All About Airbnb

Profitability of Airbnb Property Investment: Homes for sale in Tucson, Arizona

airbnb property investment Tucson

Are you looking to invest in an academic city with plenty of great passive income opportunities? Check out Tucson! This city’s diverse culture and incredible cuisine are only a few of the reasons why plenty of tourists visit every year, but there’s so much more to discover in Tucson. Known for being the hometown of world-renowned universities in the world, this city is ideal for property investors who want to engage with the student market.

On the other hand, it’s highly recommended to learn about buying a property for Airbnb in order to make sure that it’s profitable. To begin with, it’s certainly important to consider the major costs and revenue before deciding to purchase a property in Tucson. Another excellent option is to do rental arbitrage in Tucson as it’s fairly popular and does not require you to purchase a property.

Here’s an interesting fact: Tucson is one of the best places to Airbnb in Arizona!

.

“The current state and potential growth of the Tucson economy indicate good returns for a real estate investor.
The Tucson real estate market has been booming and attracting a lot of interest from investors, corporations and households.”

– Foothills Properties on Tucson Real Estate

Aside from looking at a property’s fascinating architectural design, proximity to major tourist areas, and accessibility to the best go-to places, the primary step is to determine profitability. In this article, we’ll discuss the metrics in order to gauge the best property investment.

This includes the best website recommendations for property investment in Tucson, property gross rental yield, cash-on-cash return, and annual revenue, along with some of the most ideal and profitable properties according to their location. Stoked to learn more? Continue reading!

Top reasons for buying an Airbnb Property in Tucson 

Best known for its sunny skies and desert landscapes, Tucson offers everyone the opportunity to immerse themselves in its natural surroundings and fascinating history. However, there’s more to learn as to why we recommend purchasing a property in this city. Here are some of the major reasons why you should consider buying a property for Airbnb in Tucson:

1. You will find the real estate market here attractive

The housing market in Tucson offers a wide variety of property types as well as prices, so you won’t need to dig deep to find an affordable house! The median property value in this city is $349k, trending up 7.7% year-over-year. 

2. The tourism industry in Tucson

Surrounded by the Sonoran Desert, Tucson is home to renowned places like the Saguaro National Park and the Arizona-Sonora Desert Museum that attract many travelers from many places! Thanks to its iconic landmarks, the tourism and accommodation sectors are one of the top contributors to Tucson’s economy. In fact, this city welcomes over 1M visitors annually.

3. Affordable cost of living

Did you know that Tucson is one of the top cities in the US that has the lowest cost of living? That’s another great aspect of Tucson! The cost of living here is 5% lower than the nation’s average and 6% less expensive than in other cities in the state.

Expectations When Buying A Property in Tucson

Aside from the pros of investing in a property in Tucson, let’s discuss some of the cons so you can know what to expect when living in this fascinating city. It’s always better to look at the two sides of each coin in order to properly set your expectations!

1. Crime rate: Higher than the average

Sadly, one of the biggest downsides in Tucson is its significantly high crime rate. If we delve deeper into this matter, we will find out that the crime rate here is 84% higher than the national average. When it comes to property crime, the chance of becoming a victim is 1 in 25 based on the NeighborhoodScout report.

2. Fiery weather

It’s a given fact that the sunny weather in Tucson allows locals and travelers alike to enjoy many outdoor activities without much hassle. However, that doesn’t mean it’s all rosy because its hot weather can get really unbearable at some point.

Best Neighborhoods for Airbnb in Tucson

Let’s take a closer look at the important Airbnb key metrics to discover which is the most profitable neighborhood in Tucson. Filtered for a 1-bedroom apartment, here is a brief overview of some of the most recommended and profitable neighborhoods:

airbnb property investment Tucson

1. Sam Hughes
  • Annual Revenue: $41,722
  • Occupancy Rate: 89%
  • Average Daily Rate: $119
2. Armory Park
  • Annual Revenue: $38,783
  • Occupancy Rate: 88%
  • Average Daily Rate: $118
3. West University
  • Annual Revenue: $39,276
  • Occupancy Rate: 87%
  • Average Daily Rate: $125

Is Property Investment Profitable in Tucson, AZ?

Using a short-term rental income calculator, it was discovered that a 2-bedroom apartment in Tucson City Center can generate an annual revenue of $50,730 with a steady occupancy rate of 79% and a nightly rate of $146.

airbnb property investment Tucson

airbnb property investment Tucson

Cheap Homes & Properties For Sale in Tucson, Arizona

Finding the best properties that have the potential to produce high yields and capital growth are certainly some of the preferences of major investors. It’s always best to ask for assistance from real estate agents to access exclusive and unique properties during the development stage. 

At the same time, it’s even better when a property investor like you conducts research about predicted growths and market forecasts. Here are some of the profitable properties in Tucson City Center along with the calculated gross rental yield, cash-on-cash return, and annual revenue.

airbnb property investment Tucson

8030 E Broadway Blvd Unit B104, Tucson, AZ 85710

1. Studio-type Property for SaleTucson
  • 0.7 miles to Harold Steele Elementary School
  • Asking Price: $72,500
GROSS RENTAL YIELD 24.51%
ANNUAL REVENUE $17,767.
CASH ON CASH RETURN 47.75%
airbnb property investment Tucson

8701 S Kolb Rd Unit 02-245, Tucson, AZ 85756

2. 1-Bedroom Type Property for Sale Tucson
  • 0.6 miles to Vail Academy & High School
  • Asking Price: $56,000
GROSS RENTAL YIELD 32.51%
ANNUAL REVENUE $18,203
CASH ON CASH RETURN 71.75%
airbnb property investment Tucson

2752 W Milton Rd, Tucson, AZ 85746

3. 2-Bedroom Type Property for Sale Tucson
  • 0.4 miles to Pistor Middle School
  • Asking Price: $95,000
GROSS RENTAL YIELD 25.46%
ANNUAL REVENUE $58,531
CASH ON CASH RETURN 50.61%
3-bedroom Tucson
3-bedroom Tucson

16665 N Avenida De La Reata, Tucson, AZ 85739

4. 3-Bedroom Type Property for Sale Tucson
  • 2.3 miles to Coronado K-8 School
  • Asking Price: $119,000
GROSS RENTAL YIELD 26.41%
ANNUAL REVENUE $31,425
CASH ON CASH RETURN 53.46%
4-bedroom Tucson
4-bedroom Tucson

202 W Pennsylvania Dr, Tucson, AZ 85714

5. 4-Bedroom Type Property for Sale Tucson
  • 0.5 miles to Hollinger Elementary School
  • Asking Price: $169,900
GROSS RENTAL YIELD 26.13%
ANNUAL REVENUE $44,397
CASH ON CASH RETURN 52.63%

Conclusion

Investing in a property is certainly an important decision that one needs to not only think about but also it’s essential to conduct market research for accuracy. With the various recreational activities as well as an attractive real estate market in Tucson, it can generate a nice cash flow for property investors as long as the right neighborhood is targeted and potential revenue is calculated using an Airbnb rental arbitrage calculator. However, it would be a wise choice to look for a security system for your property if you invest here. While there are many other cities to invest in Arizona aside from Tucson, it’s definitely worth the time & effort to speak with a short-term rental expert to make the wisest decision for property investment.

Categories
Airbnb Occupancy All About Airbnb

Airbnb Occupancy Rates in Japan: Most profitable cities to invest in!

Looking for the best cities in Japan to invest in? Check out the best 20 cities for Airbnb in Japan with the highest occupancy rates!

airbnb occupancy rates japan

Looking for the best cities in Japan to invest in? Check out the best 20 cities for Airbnb in Japan with the highest occupancy rates!

Japan is a country that almost everyone has on their travel wish list in their lives, which is understandable considering how captivating this country is. This country offers many unique experiences linked to its culture, gastronomy, technology, the anime & manga world, literature, and has fascinating cities.

Dozens of tourists visit this Asian country every year looking to immerse themselves in Japan’s exciting culture and its natural surroundings. Hence, investing in an Airbnb property in Japan can be a profitable business idea.

Still, before taking a huge step and purchasing a property investment in Japan, you should analyze carefully which city to target and determine the profitability based on Airbnb’s important key metrics. 

In this article, you will find the top 20 best cities for Airbnb in Japan along with their respective occupancy rates, monthly & yearly revenue, average daily rates (ADRs), and more. Are you eager to learn more? Then you should continue reading!

Why Invest in an Airbnb Property in Japan?

airbnb occupancy rates japan

Japan is a country rich in history, tradition, culture and technology that opens the doors to endless adventures and opportunities. But what advantages does this country have for investors? Here are the top reasons why you should invest in an Airbnb property in Japan:

  • Japan’s bustling tourist market

Japan ranks high when it comes to being a tourist destination as it attracts millions of visitors every year. Before the pandemic, Japan welcomed around 31M tourist arrivals, ranking 3rd as the most visited country in Asia. 

While after COVID, Japan’s tourism declined, but the digits were steadily growing. In 2022, nearly 4M travelers visited the country. In addition to this, Airbnb also worked alongside the Japanese government to support its tourism recovery! 

  • Japan’s economy: Leadership in technology and innovation

Japan is widely known for its technological advances and innovative infrastructure. On top of that, Japan ranks 4th among the 17 economies in South East Asia, East Asia, and Oceania. Investing in Japan means that you will have access to many resources with one of the fastest internet connections and a great infrastructure. In addition to this, Japan also has one of the best public transportation systems in the world!

  • Buying property as a foreigner in Japan is easy

Japan is one of the few countries that doesn’t have legal restrictions on foreigners when it comes to buying property. Unlike most countries, if you’re a foreigner looking to invest in this country, you won’t be asked to do special procedures or pay high fees. At the same time, you won’t be required to have a Japanese residency card either. However, please note that purchasing a property here doesn’t mean that you will be qualified to obtain a residence visa.

In addition to the advantages mentioned above, you should also know that Japan ranks among the top 3 short-term rental markets in Asia. Japan also has an average occupancy rate of 23% and an average daily rate (ADR) of $72 (¥9,438)

Is Airbnb legal in Japan?

While knowing Airbnb’s key metrics is important, it’s also essential to consider if short-term rentals are legal in the city you want to invest in or not. Now, let’s cut to the chase –  Airbnb is legal in Japan! 

If you’re wondering,  “is Airbnb legal in Tokyo?” then you should also check on the short-term regulations.

For example, to operate a short-term rental in Japan, you need to register your listing and display the license number. However, depending on where is your listing located, you may need to follow different regulations. You can check Japan enforcement’s order to know more about each specific law.

Airbnb Occupancy Rates in Japan: Top 20 Japanese Cities

Japan offers attractive investment opportunities, thus, it’s understandable that this country caught property investors’ attention. But there are still major doubts: where you should invest in Airbnb properties in Japan? Should you invest in a short-term rental in Okinawa or Tokyo?

To figure out the best cities to do short-term rental investments in Japan, we used Airbtics’ calculator to find out the top 20 markets with the highest occupancy rates:

1. Matsue
  • Total Number of Airbnb Listings: 28
  • Airbnb Annual Revenue: ¥2,143,995 ($16,427)
  • Average Daily Rate: ¥12,138 ($93)
  • Occupancy Rate: 56%
  • Median Property Price: ¥18,430,000 ($141,208)
  • Gross Rental Yield: 11.6%
2. Sendai
  • Total Number of Airbnb Listings: 46
  • Airbnb Annual Revenue: ¥1,443,904 ($11,063)
  • Average Daily Rate: ¥7,309 ($56)
  • Occupancy Rate: 50%
  • Median Property Price: ¥24,020,000 ($184,038)
  • Gross Rental Yield: 6.0%
3. Matsuyama
  • Total Number of Airbnb Listings: 53
  • Airbnb Annual Revenue: ¥1,264,705 ($9,690)
  • Average Daily Rate: ¥7,178 ($55)
  • Occupancy Rate: 47%
  • Median Property Price: ¥15,480,000 ($118,606)
  • Gross Rental Yield: 8.2%
4. Hakone
  • Total Number of Airbnb Listings: 99
  • Airbnb Annual Revenue: ¥2,342,249 ($17,946)
  • Average Daily Rate: ¥13,835 ($106)
  • Occupancy Rate: 46%
  • Median Property Price: ¥34,520,000 ($264,488)
  • Gross Rental Yield: 6.8%
5. Saitama
  • Total Number of Airbnb Listings: 31
  • Airbnb Annual Revenue: ¥1,384,780 ($10,610)
  • Average Daily Rate: ¥7,178 ($55)
  • Occupancy Rate: 46%
  • Median Property Price: ¥28,140,000 ($215,605)
  • Gross Rental Yield: 4.9%
6. Kobe
  • Total Number of Airbnb Listings: 142
  • Airbnb Annual Revenue: ¥1,890,140 ($14,482)
  • Average Daily Rate: ¥ ($95)
  • Occupancy Rate: 41%
  • Median Property Price: ¥23,590,000 ($180,743)
  • Gross Rental Yield: 8.0%
7. Yokohama
  • Total Number of Airbnb Listings: 179
  • Airbnb Annual Revenue: ¥1,710,158 ($13,103)
  • Average Daily Rate: ¥9,919 ($76)
  • Occupancy Rate: 41%
  • Median Property Price (2-bedroom): ¥34,520,000 ($264,488)
  • Gross Rental Yield: 5.0%
8. Tokyo
  • Total Number of Airbnb Listings: 8,426
  • Airbnb Annual Revenue: ¥1,536,310 ($11,771)
  • Average Daily Rate: ¥9,136 ($70)
  • Occupancy Rate: 39%
  • Median Property Price: ¥62,510,000 ($478,943)
  • Gross Rental Yield: 2.5%
9. Kanazawa
  • Total Number of Airbnb Listings: 307
  • Airbnb Annual Revenue: ¥1,517,124 ($11,624)
  • Average Daily Rate: ¥12,138 ($93)
  • Occupancy Rate: 38%
  • Median Property Price: ¥19,200,000 ($147,108)
  • Gross Rental Yield: 8.0%
10. Nagoya
  • Total Number of Airbnb Listings: 396
  • Airbnb Annual Revenue: ¥1,486,322 ($11,388)
  • Average Daily Rate: ¥8,614 ($66)
  • Occupancy Rate: 37%
  • Median Property Price: ¥23,170,000 ($177,525)
  • Gross Rental Yield: 6.4%
11. Takayama
  • Total Number of Airbnb Listings: 186
  • Airbnb Annual Revenue: ¥2,001,471 ($15,335)
  • Average Daily Rate: ¥14,226 ($109)
  • Occupancy Rate: 36%
  • Median Property Price: ¥17,090,000 ($130,941)
  • Gross Rental Yield: 11.8%
12. Fukuoka
  • Total Number of Airbnb Listings: 898
  • Airbnb Annual Revenue: ¥1,029,906 ($7,891)
  • Average Daily Rate: ¥6,134 ($47)
  • Occupancy Rate: 36%
  • Median Property Price: ¥21,850,000 ($167,412)
  • Gross Rental Yield: 4.7%
13. Nara
  • Total Number of Airbnb Listings: 172
  • Airbnb Annual Revenue: ¥1,031,994 ($7,907)
  • Average Daily Rate: ¥6,787 ($52)
  • Occupancy Rate: 36%
  • Median Property Price: ¥14,980,000 ($114,775)
  • Gross Rental Yield: 6.9%
14. Beppu
  • Total Number of Airbnb Listings: 139
  • Airbnb Annual Revenue: ¥1,219,677 ($9,345)
  • Average Daily Rate: ¥8,745 ($67)
  • Occupancy Rate: 34%
  • Median Property Price: ¥17,160,000 ($131,478)
  • Gross Rental Yield: 7.1%
15. Sapporo
  • Total Number of Airbnb Listings: 1,030
  • Airbnb Annual Revenue: ¥1,256,221 ($9,625)
  • Average Daily Rate: ¥7,962 ($61)
  • Occupancy Rate: 34%
  • Median Property Price: ¥20,010,000 ($153,314)
  • Gross Rental Yield: 6.3%
16. Chiba
  • Total Number of Airbnb Listings: 61
  • Airbnb Annual Revenue: ¥1,001,323 (7,672)
  • Average Daily Rate: ¥6,395 ($49)
  • Occupancy Rate: 34%
  • Median Property Price: ¥24,140,000 ($184,957)
  • Gross Rental Yield: 4.1%
17. Okinawa
  • Total Number of Airbnb Listings: 109
  • Airbnb Annual Revenue: ¥1,409,187 ($10,797)
  • Average Daily Rate: ¥9,789 ($75)
  • Occupancy Rate: 34%
  • Median Property Price: ¥34,300,000 ($262,802)
  • Gross Rental Yield: 4.1%
18. Nikko
  • Total Number of Airbnb Listings: 135
  • Airbnb Annual Revenue: ¥1,249,826 ($9,576)
  • Average Daily Rate: ¥9,267 ($71)
  • Occupancy Rate: 33%
  • Median Property Price: ¥19,510,000 ($149,483)
  • Gross Rental Yield: 6.4%
19. Hiroshima
  • Total Number of Airbnb Listings: 413
  • Airbnb Annual Revenue: ¥1,202,318 ($9,212)
  • Average Daily Rate: ¥9,397 ($72)
  • Occupancy Rate: 33%
  • Median Property Price: ¥22,670,000 ($173,695)
  • Gross Rental Yield: 5.3%
20. Nagasaki
  • Total Number of Airbnb Listings: 103
  • Airbnb Annual Revenue: ¥1,023,771 ($7,844)
  • Average Daily Rate: ¥7,048 ($54)
  • Occupancy Rate: 32%
  • Median Property Price: ¥20,440,000 ($156,608)
  • Gross Rental Yield: 5.0%

Summary

Japan is undeniably a beautiful country that offers endless opportunities to property investors. On top of that, most Japanese cities offer affordable real estate options with attractive markets for Airbnb that can generate a nice amount of cash for hosts.

There are many profitable cities in Japan with good occupancy rates, yet there’s always a risk if you decide to invest in a market before analyzing the important metrics. Thus, it’s always recommended to conduct market research using short-term rental analytics tools like Airbtics.

 Take the advantage of living in the digital era and use a short-term rental estimator to discover your market profitability and stand out among your competitors!

Unlock Worldwide
Short-Term Rental Data
Find unsaturated neighborhoods with the highest occupancy history.

Unlock Worldwide
Short-Term Rental Data
Find unsaturated neighborhoods with the highest occupancy history.

airbnb occupancy rates japan

Annual Airbnb Revenue in Fairmont minnesota, USA

Fairmont, Minnesota| Airbnb Market Data & Overview | USA Fairmont, Minnesota Airbnb Market Data & Overview USA Is it profitable to do Airbnb in Fairmont, …

Read More →
Annual Airbnb Revenue in Devon, UK

Annual Airbnb Revenue in Devon, UK How Much Can I Make With Airbnb In Devon , UK? Is it profitable to do Airbnb in Devon, …

Read More →
Annual Airbnb Revenue in Weirton west virginia, USA

Weirton, West Virginia| Airbnb Market Data & Overview | USA Weirton, West Virginia Airbnb Market Data & Overview USA Is it profitable to do Airbnb …

Read More →
Annual Airbnb Revenue In Shibuya City Japan

Shibuya City| Airbnb Market Data & Overview | Japan Shibuya City Airbnb Market Data & OverviewJapan Is it profitable to do Airbnb in Shibuya City, …

Read More →
Annual Airbnb Revenue In Ibiza Spain

Ibiza| Airbnb Market Data & Overview | Spain Ibiza Airbnb Market Data & OverviewSpain Is it profitable to do Airbnb in Ibiza, Spain? What is …

Read More →
Tarifa por Fumar Airbnb
Tarifa por Fumar en el Airbnb: Cómo reclarmarla en Airbnb?

Métricas clave La protección contra daños para anfitriones de Airbnb cubre los reclamos de los mismos por daños, costos de limpieza o pérdida de ingresos. …

Read More →

Free Webinar

Learn Airbtics in 7 Minutes

Revenue and market analysis Tips and Best Practices!
Airbnb Data
Airbnb Data

ARE YOU IN?

Get Access to our weekly data-driven airbnb report!