fbpx
🎉 FREE WEBINAR - July 24th, 11am / 8pm CET - Learn Airbtics in 7 Minutes - Revenue and Market Analysis Tips and Best Practices!
Categories
All About Airbnb Alternatives & Reviews

How accurate is AirDNA? I tried it for a month.

benoit-properties-portfolio

I first used AirDNA back in 2019 to find the most profitable London boroughs for my Airbnb Arbitrage business.  
I first used AirDNA back in 2019 to find the most profitable London boroughs for my Airbnb Arbitrage business. I decided to purchase their expensive subscription, which was over $200 (I think). Before going further, this is just my personal story about my experience with AirDNA, its data accuracy, and why I built Airbtics.


I was skeptical about their data accuracy, so I asked a few Airbnb host friends if their income matched what’s shown on AirDNA’s Rentalizer. I got mixed results. Half said it’s similar, and half said it’s far.

My job back then was a software developer at WhatsApp, so as a developer, I started to dig into how they collected the data. By reading their pages, I can tell that they 1) scrape from Airbnb listings and 2) get booking data directly from hosts who have agreed to give them the data. That’s cool.

Then, my question was, if they scrape the data from Airbnb calendars, how can they tell if a listing was booked by a guest or blocked by a host? Because I played with Airbnb’s API, and they do not show whether a night is booked by a guest or blocked by a host. It just shows it as “blocked”. AirDNA says that Airbnb used to show this information back in 2014, and they took advantage of that and built a classifier. That’s interesting.

So, here’s a small tip.

Verify your data using ENEMY method

Along with the calculator, you can also use the ENEMY method to ensure you estimate the accurate amount of revenue. The ENEMY method simply means going to the Airbnb site to find 5-10 listings that are most similar to the house you want to list on Airbnb. Then, check how many days are booked in the next 6-8 weeks. Also, check how many reviews on average they get every month. Compile them on an Excel sheet. You may see some interesting patterns.

Anyway, thanks to AirDNA, I realized Airbnb Arbitrage won’t be that profitable in London. That is lucky to me because the Covid hit hard a few months after I made this conclusion.

My thoughts on AirDNA’s rentalizer

I’ve had a few difficulties using AirDNA. One is that they do not have some markets in Asia and South America where I was interested in buying an investment property. Another problem is their submarket boundary definition. On some occasions, two areas in a submarket have a completely different average occupancy rate. A common example is that, in beach town, properties that are right by the ocean have a higher occupancy than the ones that are located inland. Also, I was not convinced about their approach to data accuracy.

So, I built Airbtics, which is an alternative to AirDNA. It has a tailored region feature where you can draw a shape in any markets to get short-term rental data. It has dynamic data updating feature which you can see the Airbnb statistics of the exact micro area you see on the map. Finally, I’ve improved data accuracy of Airbnb occupancy rate data by following method: By labeling the millions of “review” data. Basically, if a series of blocked nights on Airbnb calendar generates a review in the future, we can label those nights as “confirmed booked”. By doing this, our data accuracy improved by 98%, and we were able to score some deals with big-name hedge funds.

Categories
Airbnb Investment All About Airbnb

Investing in short term rentals: Is it really Low risk and high return investment?

Investing-in-short-term-rentals-Is-it-really-Low-risk-and-high-return-investment

Investing in short-term rental is buying the most stable asset (which is housing) with rental profit twice higher than traditional rentals.

Investing in short-term rental is buying the most stable asset (which is housing) with rental profit twice higher than traditional rentals. Considering buying a short-term rental property? You are at the right blog.

Housing has been the best-performing asset class in history, according to research tracking various assets over 145 years. Better than stocks. This was documented going back to 1870 in a 2017 paper from the Federal Reserve Bank of San Francisco titled The Rate of Return on Everything, 1870-2015. The average real return on global housing from 1870 to 2015 was 7.05% compared to 6.89% for equities. The housing return also came with a substantially lower standard deviation – meaning less risks.

However, real estate has some unique limitations, making it impossible for any individual investor to access safe and high returns. Foremost, the paper assumed that you invested in 16 countries at the same time, and managed the properties efficiently without any gaps in long-term tenants. Sounds easy, right? But here’s a little secret: Individual investors can compensate for the lower rate of return by investing in short term rentals. Even just renting out as a short-term rental for 5 years can compensate for your average return. Let’s analyze why short term rental investment has incredibly good return with low risk.

Airbnb Profitability Analysis in Savannah, GA (Example)

It is important to note that the real estate return includes both the asset’s price increase and the net rental income. Each makes up about half of the total return according to the research.

For instance, consider Savannah, GA, where the average home price in 2023 stood at $199,950. Factoring in additional costs such as closing fees and maintenance expenses, investors face an initial investment of $205,950. However, adept management of a short-term rental property can yield substantial profits, often surpassing those of traditional long-term leases.

Taking a conservative approach, assuming a modest annual property appreciation rate of 5.5%, investors can anticipate an average annual return of 9.28% after a decade. Compare this to the S&P 500’s 9.67% average annual return during a similar period. However, the real game-changer lies in Airbnb rentals. With an average 1-bedroom Airbnb fetching $42,632 annually, albeit with higher maintenance costs, investors can enjoy a monthly profit boost of $863, translating to an impressive 12.01% rate of return. Moreover, strategic management can push this figure even higher, reaching up to 13.63% for top-performing listings (Applied estimated revenue of top 25% Airbnb listings in Savannah) or potentially 14.23% for properties acquired below market value (20% BMV).

(The return looks something like this)

Annual-Return-Rate

What’s incredible about buying a short term rental property is this – There are so many variables you can control. Unlike investing in stocks, you can manage your property better for better returns. Unlike stocks, you can also find investment properties lower than market value.

Mitigating Risks in Short-Term Rental Investments

Despite its promises, investing in short-term rentals does not come without risks. Regulatory uncertainties, such as city-imposed restrictions or bans on short-term rentals, can disrupt income streams. However, even in adverse scenarios, the underlying asset’s value tends to appreciate steadily, offering a buffer against regulatory upheavals. Additionally, the potential underperformance of property values can be mitigated through diversification across markets, leveraging the lower correlation between real estate markets compared to stocks.

Can you manage your Airbnb remotely?

How can you manage internationally or in different countries? This is, in fact, easier than many think, and it’s a common practice nowadays. The smart lock allows guests to check in without you. You can manage door lock settings remotely just from your mobile phone. For maintaining the property, you can use a platform like Turno to find local cleaners for your Airbnb. Once things are set up right, visiting the property once a year can be enough for you to get year-round bookings.

Find out how much you can make on Airbnb with analytics!

If short-term rentals sound like a cool idea, why don’t you spend 2 minutes using Airbnb Analyzer to check the average occupancy rate of your markets? It’s all free!

If you don’t see good numbers in your market, you can identify other lucrative markets. You can use the heatmap feature to locate the most profitable areas and types of properties.

Categories
Guides Most Profitable Airbnb

Best Airbnb Markets Ranked by Data Scientist

top_12_us_airbnb_markets_ranked

I’ve analyzed the profitability of 12 US Airbnb markets. The primary factor is how much you will make in 10 years from an average short-term rental investment in a market. I discovered markets from 350% return in 10 years to 150% return.
If you have a high paying full time job, short-term rental investment may be the fastest way to achieve financial freedom.

90% of millionaires attribute their wealth in part to real estate holdings. Thanks to Airbnb, you can increase rental income from your investment property.

Real estate is all about location. So, today, I’ve ranked 12 cities into 4 different tiers depending on how much wealth it will bring to you in 10 years. Where did I get this list? I chose the markets that other short-term rental YouTubers and bloggers claim to be the best Airbnb markets.

List of cities we’ll cover

  • Chicago 
  • Columbus, GA 
  • Flagstaff 
  • Gatlinburg 
  • Green Bay
  • Houston 
  • Joshua Tree 
  • Miami 
  • San Francisco
  • Santa Cruz 
  • Savannah 
  • Seattle 
  • South Bend 

Methodology

How much will you make from this investment in 10 years is the primary factor for ranking. I call this 10 years ROI. 10 years ROI comes from home value appreciation and profits from running an Airbnb.

Assumptions 

  • All cash purchase (No mortgage) 
  • 2023 data for home value and short-term rental revenue 
  • 1-bedroom house investment 
  • Closing cost and furnishing cost not included 

Home Price Forecast (2024 – 2033) model used the following 3 factors 

  • 5 years home price change 
  • 5 years average income level change 
  • 5 years population change 

I used a model that predicts the next 10 years’ home value appreciation based on historical property prices, population, and income changes. I won’t go into details about this prediction model, but you can find this in the Airbtics app. Here is one example of how the model works. If the average home price has been increasing rapidly, let’s say 15% a year, but the total population and average income are not growing as fast as the housing price, then, the model will correct the home value appreciation rate to be lower than the past years.

For your information, If you take a mortgage, the ROI will become a lot higher. Also, I did include the tax and initial starting cost. You have to spend money on furnishing, as well as, closing the property. 

Investing in mountain destinations 

Let’s start with 3 mountain destinations. I recommend you to do an Airbnb in a place you’d like to visit once in a while. This can help or even push you to make time to do your hobby. So, if you like snowboarding or hiking, investing in a mountain can be an exciting option. The downside is that it will be hard to find a long-term or mid-term tenant when the short-term rental demand goes down. However, the local governments are short-term rental friendly because tourism is their major industry. There’s very little regulatory risk.

Gatlinburg is a gateway town to the Smoky Mountains. It’s 3-4 hours drive to Nashville and Atlanta. You need to get a short-term rental permit and maintain certain conditions to be an Airbnb host here. This kind of regulation is good for the short-term rental industry in the long run.

Gatlinburg
Rank: 11th – Should have invested in S&P 500
10 years ROI: 197% 
Net Yield: 5% 
Home Price Forecast 2023 – 2032: 8.1% 
Occupancy Rate: 73% 
Average Daily Rate: $153 
Yearly Airbnb Revenue: $40k 
Property Price (2023): $478k 
Home Value Trend: 7.9% per year 
Population Trend: 3.1% per 5 years 
Income Trend: 35.1% per 5 years 

Flagstaff is a gateway town to San Francisco Peaks. Another similar town is Sedona. It’s a 3-4 hour drive to Phoenix. This city doesn’t get as warm as Phoenix due to its high altitude. This place is getting popular rapidly these days.

Flagstaff
Rank: 10th – Should have invested in S&P 500
10 years ROI: 206%
Net Yield: 5%
Home Price Forecast 2023 – 2032: 8.25%
Occupancy Rate: 71%
Average Daily Rate: $110
Yearly Airbnb Revenue: 29K
Property Price (2023): 325K
Home Value Trend: 9.5% per year 
Population Trend:  4.4 per 5 years
Income Trend:  25.7 per 5 years

Joshua Tree might be your place If you are looking for some wilderness near Los Angeles. It’s where two distinct desert ecosystems meet, the Mojave and the Colorado.

Joshua Tree
Rank: 8th – Should have invested in S&P 500
10 years ROI: 244%
Net Yield: 6%
Home Price Forecast 2023 – 2032: 8.75%
Occupancy Rate: 62%
Average Daily Rate: $143
Yearly Airbnb Revenue: 33K
Property Price (2023): 349K
Home Value Trend: 9% per year
Population Trend: 3% per 5 years
Income Trend: 37.0% per 5 years

Investing in Rural and Suburb 

Now, we’ll go through rural & Suburban towns. You can find the cheapest properties in rural and suburban areas. These are the ones without major tourist attractions like ski resorts or Disneyland. There are some rural areas with good short-term rental demands, and it’s for work like traveling nurses or construction workers, or sometimes, college student’s families. I believe rural and suburban areas tend to be the best markets for high return on investment.

Green Bay is a rural town known for the Green Bay Packers. It’s in Wisconsin, a very peaceful state. I included this in the list because I went to high school here for 6 months. People use Airbnb for business trips, to visit their family, and occasionally travelers.

Green Bay
Rank: 4th – Congrats (300%)
10 years ROI: 258%
Net Yield: 11%
Home Price Forecast 2023 – 2032: 7.0%
Occupancy Rate: 42%
Average Daily Rate: $128
Yearly Airbnb Revenue: 20K
Property Price (2023): 109K
Home Value Trend: 6.3% per year 
Population Trend: 3.9% per 5 years 
Income Trend: 30.6% per 5 years

South Bend is a suburban town in Indiana and home to Notre Dame University. Two hours away from Chicago International Airport. The two main industries here are health care and education. So, you can expect to receive traveling nurses and college students’ families as your guest.

South Bend
Rank: 2nd – to the moon (400% in 10 years)
10 years ROI: 363%
Net Yield: 19%
Home Price Forecast 2023 – 2032: 6.6%
Occupancy Rate: 54%
Average Daily Rate: $111
Yearly Airbnb Revenue: 24K
Property Price (2023): 75K
Home Value Trend7.0% per year
Population Trend: 1.2% per 5 years
Income Trend: 28.3% per 5 years

Columbus is a suburban town in Georgia. To do short-term rentals, you need to apply for a vacation rental permit. The city seems to put heavy effort in bringing more tourists. There are some good museums, like the Columbus Synchronous Orchestra and the Columbus Museum.

Columbus
Rank: 1st – to the moon
10 years ROI: 379%
Net Yield: 22%
Home Price Forecast 2023 – 2032: 5.75%
Occupancy Rate: 71%
Average Daily Rate: $78
Yearly Airbnb Revenue: $19K
Property Price (2023): $51K
Home Value Trend: 4.1% per year
Population Trend: 5.2% per 5 years
Income Trend: 26% per 5 years

Investing in coastal towns 

Coastal towns attract year-round visitors, whether it’s for beach or fishing or port. For this reason, housing prices tend to be more expensive near the coast. But, the short-term rental revenue is also high.

Savannah. What’s noticeable here is the high average Airbnb rental revenue, it’s 43k per year. The average daily rate is $163 per night, and among the cities we reviewed so far, this is the highest number. The property price isn’t too expensive either, Just about 200k. This gives 316% 10 years ROI, so it goes to the congrats tier!

Savannah
Rank: 3rd – Congrats! (300%)
10 years ROI: 316%
Net Yield: 13%
Home Price Forecast 2023 – 2032: 7.95%
Occupancy Rate: 69%
Average Daily Rate: $163
Yearly Airbnb Revenue: 43K
Property Price (2023): 200K
Home Value Trend: 7.6% per year
Population Trend: 7.7% per 5 years
Income Trend: 28.5% per 5 years

Miami is one of the most known vacation destinations attracting a huge number of international travelers. More and more businesses are opening branches in Florida, such as Goldman Sachs and Blackstone. It has a good international airport serving flights to cities in Latin America and Europe.

Miami
Rank: 5th – Should have invested in S&P 500
10 years ROI: 250%
Net Yield: 8%
Home Price Forecast 2023 – 2032: 8.45%
Occupancy Rate: 69%
Average Daily Rate: $143
Yearly Airbnb Revenue: 33K
Property Price (2023): 253K
Home Value Trend: 9.3% per year
Population Trend: 1.7% per 5 years
Income Trend: 33.5% per 5 years

Santa Cruz is a nice surfing town for someone based in the Bay Area. When I was working at Meta, I heard someone commuting from Santa Cruz to the Menlo Park Meta office. He bragged that the 17 highway has a nice view.

Santa Cruz
Rank: 12th – Should have invested in S&P 500
10 years ROI: 179%
Net Yield: 5%
Home Price Forecast 2023 – 2032: 7.6%
Occupancy Rate: 68%
Average Daily Rate: $183
Yearly Airbnb Revenue: 44K
Property Price (2023): 563K
Home Value Trend: 7.6% per year
Population Trend-1.7% per 5 years
Income Trend: 41.7% per 5 years

Investing in urban

Urban attracts people. Property appreciation is faster. Things are always happening. Short-term rental yields are low due to high property prices, but it’s quicker to buy and sell a home, and there’s always long-term rental demand. There’s a high regulatory risk, more and more cities are enforcing new short-term rental regulations every month, like New York City and Dallas.

San Francisco is one of the most expensive cities to live in the US. There are numerous amount of high tech companies. Even Airbnb’s headquarters is here. A lot of high-paid jobs. Year round good sunny yet cool weather. I visited here quite a few times while working for Meta. I really loved the city and vibe.

However, just like New York City, they’ve been cracking down on Airbnb hosts. You can only run an Airbnb 90 days a year, and you need to be a resident of San Francisco. Some hosts bypass this law, but their fine is heavy, so I wouldn’t personally risk it.

San Francisco
Rank: 13th – Ramen profitable
10 years ROI: 174%
Net Yield: 3%
Home Price Forecast 2023 – 2032: 8.4%
Occupancy Rate: 76%
Average Daily Rate: $154
Yearly Airbnb Revenue: 42K
Property Price (2023): 812K
Home Value Trend: 8.4% per year
Population Trend: 1.1% per 5 years
Income Trend: 39.5% per 5 years

Seattle allows one secondary home to be let out as a short-term rental. If you are looking to diversify your short-term rental investment portfolio, Seattle can be a great option too.

Seattle
Rank: 6th – Should have invested in S&P 500
10 years ROI: 249%
Net Yield: 4%
Home Price Forecast 2023 – 2032: 10.8%
Occupancy Rate: 77%
Average Daily Rate: $128
Yearly Airbnb Revenue: 35K
Property Price (2023): 570K
Home Value Trend: 11.5% per year
Population Trend: 7.1% per 5 years
Income Trend: 38.7% per 5 years

In Chicago, you need to apply for a short-term rental permit, and the process is quite straightforward. This puts this city in a better position than Seattle and San Francisco. I think Chicago is a great place to live. Good job opportunities. And still cheap property price.

Chicago
Rank: 9th – Should have invested in S&P 500
10 years ROI: 217%
Net Yield: 11%
Home Price Forecast 2023 – 2032: 5.65%
Occupancy Rate: 65%
Average Daily Rate: $121
Yearly Airbnb Revenue: 28K
Property Price (2023): 157K
Home Value Trend: 5.3% per year
Population Trend: 0.2% per 5 years
Income Trend: 29.4% per 5 years

Houston doesn’t have a strict Airbnb regulation. But Recently, Dallas banned short-term rentals in residential areas. So it’s a matter of time for Houston to start STR regulation.

Houston
Rank: 7th – Should have invested in S&P 500
10 years ROI: 231%
Net Yield: 7%
Home Price Forecast 2023 – 2032: 8.15%
Occupancy Rate: 62%
Average Daily Rate: $91
Yearly Airbnb Revenue21K
Property Price (2023): 178K
Home Value Trend: 8.8% per year
Population Trend: 7.6% per 5 years
Income Trend: 24.1% per 5 years

top_12_us_airbnb_markets_ranked2

Unlock Worldwide
Short-Term Rental Data
Find unsaturated neighborhoods with the highest occupancy history.

Categories
Airbnb Investment Most Profitable Airbnb

How to Short Term Rental Analysis to Find Profitable Airbnb Markets with 425%+ 10-Year Returns [For Property Investors]

Residential property investment is one of the lowest-risk investments. But did you know you can achieve a 10% net rental yield by listing your property on Airbnb? By combining property appreciation and high cash flow, you can achieve 3-4 times the return on your investment in 10 years.

How can you make the most money out of your residential investment property? I believe the answer is running an Airbnb.

By combining high monthly cash flow from short-term rentals with annual property appreciation, you can easily achieve 3 times return on your investment in the next 10 years.

But, this is only possible in markets with high short-term rental cash flow. How can you find this?

“ Hi, I’m Jae, the founder and data scientist at Airbtics. We help investors to achieve ten thousand dollars in monthly passive income faster with short-term rental data.”

Why Short-term rental market analysis?

So, I’ve looked into short-term rental yields of more than 100 markets worldwide. As expected, there are many markets where the average expected Airbnb revenue is about the same in two cities, but the property prices are much cheaper in one city.

Here, you can find that the average net short-term rental yield varies between 9% and 22%. What I want to emphasize is that the yield varies significantly depending on the market. Keep in mind, that this is just an average. The net yield in the best market is 2.3 times higher than in the worst market.

Now, let’s take a look at the ten-year average property price changes in these markets, ranging from a 91% increase to a 33% increase in property prices over the last decade. It’s crucial to note that property price changes and net rental yields are not inversely proportional. This indicates that a market can experience both high net yield and high property appreciation.

short-term-rental-market-analysis-of-12-cities

After exploring these 29 markets through 29 simulations, it’s evident that Manchester would have generated the most wealth for you. In Manchester, the average property value increased by 91% in 10 years, translating to a 7.5% annual increase. An average short-term rental host recorded a 16.5% annual net rental yield. Your initial $100,000 investment in a short-term rental would have resulted in a total wealth of $425,000 after 10 years.If you had invested in the S&P 500, which recorded an 11% average annual appreciation, your wealth would have been a mere $235,795.

3 key factors for a profitable short-term rental market 

Alright, let’s break it down to the three key factors you should keep an eye on. These are the three. 

  • Population Growth (10 years change) 
  • Income Growth (10 years change) 
  • Short term rental yields (Last 3 years average) 

Real estate researchers agree that population and economic growth are the most fundamental property pricing drivers. There is a limited amount of land in every city. If more people want to live there, and if they can afford higher property prices, this will drive the property price.

Now, let’s talk about finding that perfect city to kickstart your Airbnb venture.

How to use short-term rental analytics tool

Alright, let’s dive into this map. It’s like your secret weapon for finding profitable markets. A high market grade here means the market has a high short-term rental yield, paired with some serious population and income growth in the last 10 years. And the best part? It’s all at your fingertips. Just click around, and boom, you’ve got the market grades of other cities right there.

Now, where do we get our data? We use official government stats for population and income levels. And when it comes to property and short-term rental data, our software is on it. We’re scanning sites like Airbnb and Zillow, monitoring over 10M listings every single week. We’ve been doing this since 2019.

Have you found an interesting market? Good, because once you spot a market that you like, head on over to the comparison tab. Voila! You can compare key market statistics side by side.

And here’s where it gets interesting – you can deep dive into the nitty-gritty of your chosen market. We’re talking key metrics like average yearly revenue, daily rates, and occupancy rates. Want to get granular? Break it down by property size, type, or even review rating score. And hey, ever wondered where those guests are traveling in from? We’ve got that covered too.

If it all checks out, hit that expand button on the map and witness the magic of the heatmap. Dark red? That’s the sweet spot – guests love that area. On the right, you can see top properties. These are the ones that are most popular among the guests in the specific neighborhoods. Pay attention to what types of properties are performing well. Want to know how much they raked in over the last twelve months? We’ve got the numbers.

Armed with this info, you’re now ready to hit up websites like Zillow or Redfin and start your property hunt. Let the treasure hunt begin!”

Unlock Worldwide
Short-Term Rental Data
Find unsaturated neighborhoods with the highest occupancy history.

Categories
Guides

2 Proven Strategies to Find Best Airbnb Markets in 2024

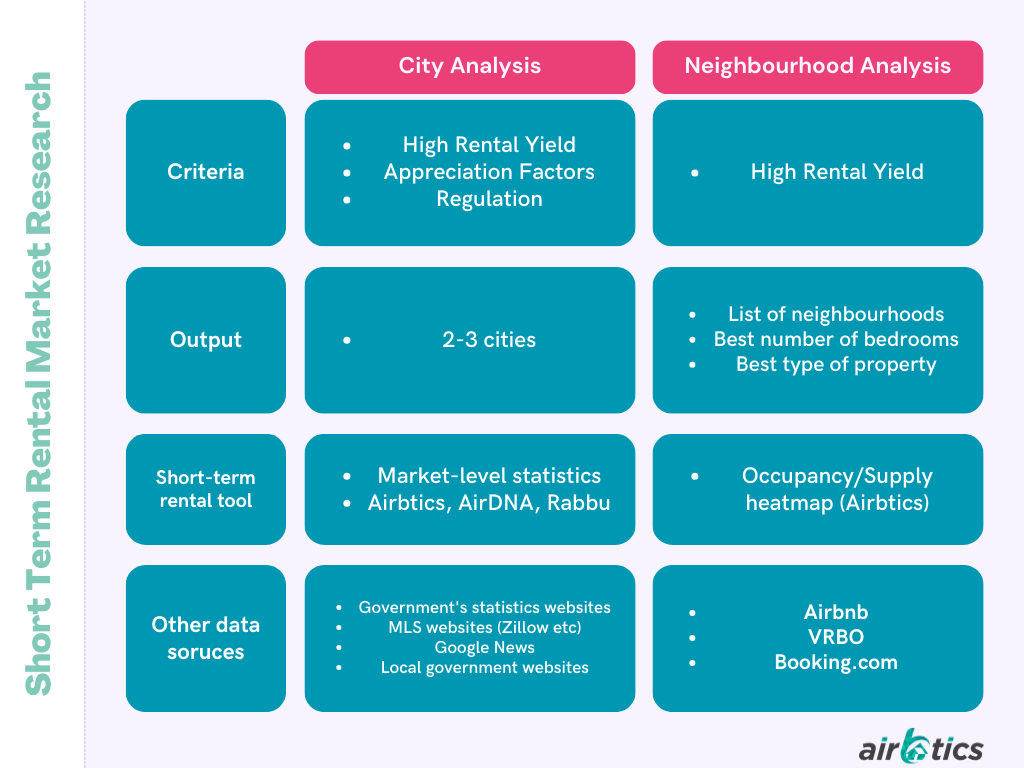
This is the complete Airbnb market research guide for property investors. 1. City analysis (high rental yield, appreciation, and regulations) 2. Neighborhood analysis.

Airbnb Market Research

This is the complete Airbnb market research guide for property investors. 1. City analysis (high rental yield, appreciation, and regulations) 2. Neighborhood analysis
Best Airbnb Markets provide you with high rental yields and good appreciation potential. The local government’s standpoint on short-term rental is important as well. 

In some markets, you can make four times more than a traditional rental. Start Airbnb in the right location! 

This blog isn’t about the top market list but about short-term rental market analysis. So, you can find profitable markets among your preferred markets. There are some blog posts and YouTube videos online talking about the top Airbnb markets. There’s a good chance that those markets will become saturated after a dozen investors enter the area this year and more next year.  

The successful short-term rental market research step is as follows 

  • City Analysis: Find 2-3 good markets with 1) high rental yield, 2) good appreciation outlook, and 3) STR-friendly government. 
  • Neighborhood Analysis: Identify the profitable neighborhoods and types of property 
Airbnb Market Research


Now you’ve found a profitable property, and it’s up and running, giving you a good rental income. What more can you do? 

Increase the value of your property as a turnkey property by 

  • Refurbishments
  • Remodel
  • Expansion
  • getting a short-term rental permit
  • increase your occupancy rate by optimizing your Airbnb listing

As you can see, there are more chances for you to increase the value of your real estate investment as a short-term rental than a traditional long-term rental.

City Analysis: 3 pillars of good short-term rental markets 

Use these 3 criteria to identify markets that will give you a better return. These pillars are for choosing the right markets, not the right property. In a market fitting those 3 criteria, you will have higher cash flow. You will expand your property investment business faster. 


Start with listing down 10 cities that you are considering to start an Airbnb. It’s good if you have some connections in the place or you’d like to spend a good amount of your time. It can be your favorite vacation spot, or have family living down there. After doing the city analysis, you will have clarity on the top 2-3 markets out of the 10 markets you were considering. 

High Airbnb Rental Yield 

The first pillar is a rental yield as a short-term rental. This is the ratio between the property price and your first-year short-term rental revenue. The higher the average rental yield, the better. 

Tip: You’ll compare different cities during this research. Choose a specific number of bedrooms to calculate your Airbnb rental yield. 


How to find short-term rental revenue in a city?

You can get this data easily from a free Airbnb analyzer. Enter any global market names after signing up for Airbtics. Then, you will get the average year-round short-term rental revenue, daily rate, and occupancy rate of a market. 

This will also answer the following questions. How much does an average listing in the city make per year? What’s the year-round average occupancy rate? How much do they charge per night? 

How does this data work? Airbtics tracks over 10 million short-term rentals from various sources every day. Please note that the occupancy rate per number of bedrooms is only available in the premium account. 

How to find an average property price? 

It’s time to find cities with cheap property prices. Heated property markets, like San Francisco, aren’t usually an ideal place. Whereas places like Joshua Tree with cheap prices, are better. 

Different countries have different sources of information 

US, Canada: Redfin, Zillow  

UK: Rightmove 

Spain, Portugal, France, Italy: Casafari 

Australia: realestate.com.au 

Market research summary

  1. 1) Use an Airbnb analytics tool to get the average Airbnb revenue potential.
  2. 2) Use a real estate site to get the average property sale price. 
  3. 3) Get gross rental yield by dividing Airbnb revenue into property prices.

Population and economic trends 

In the end, you’ll earn money from both rental income and equity appreciation. Real estate market analysis is what you need to incorporate here. Typical factors you need to look into are as follows, and you want them to be on an inclining side in the last 5 year 

– Population growth 

– Income growth 

– Crime rate decline 

– Employment rate growth 

You would also look into planned major real estate developments. 

However, you could simply focus on two major indicators: Population and income growth. You may incorporate other indicators. This sort of data is usually available from government websites. 

What you want to do here is to check population and average household income changes over the past 5 years. Then, calculate the “change rate in the past 5 years” for both population and income changes. Finally, get the average of those two rates. 

How to calculate the change rate?  it’ll be (population_2022 – population_2018) / (population_2022)

Short-term rental regulation 

Some city governments are more welcoming to visitors to the city. It’s usually the cities where tourism is a major economic activity.

 You should verify the following information for each city 

  1. 1. What is the current short-term rental regulation? 
  2. 2. How strictly is it enforced? 
  3. 3. Read through news about short-term rental regulations in the city. 

What is the current short-term rental regulation? The short-term rental regulations are somewhat similar worldwide. I’ve sorted out regulations by most “strict” to “lenient”. The one at the top is the most strict. Put the “regulation” score between 1 (strict) and 5 (lenient). 

  1. 1. The owner must live on the property 
  2. 2. Only able to rent out as a short-term rental for a certain number of days (90 days, 3. 180 days, etc) 
  3. 4. Only certain zone or type of property is allowed to do short-term rentals 
  4. 5. Required to apply for a short-term rental permit and pay annual fees 
  5. 6. Required to inform the local government 

How strictly is it enforced? Take a look at Airbnb in the market, and read the recent reviews in the listings. Verify if the laws are really enforced. They might say the owner must live on a property, but some hosts may run 10 units in the same market. There are many markets where the regulations are not properly enforced for various reasons. In this case, you should re-adjust the regulation score. 

Read through the recent 2 years’ news. Search on Google to go through the news about short-term rentals in the market. Is the mayor talking negatively about short-term rentals? You can see the sentiment towards short-term rentals by checking the news. If they talk negatively about reducing the regulation score by 1, if they talk positively about it, increase the regulation score by 1. 

How use these numbers? 

The final result should look something like this.

From here, it is up to you to determine your focused markets. There is no set-in-stone formula to determine because it depends on what you put more weight on whether short-term profit or long-term appreciation. 

Personally, I first took a look at the top 2 by Airbnb rental yield and the top 2 by appreciation factors. I removed the one with strict regulation (where they restrict STR by number of days a year). 

In the above example, I’d choose Liverpool and Lisbon for the high gross rental yield and friendly STR regulation. Their population and income changes are positive as well. 

Don’t choose more than 3 cities. You will need to do neighborhood analyses of those 3 cities as the next step. You can add more cities after doing the neighborhood analysis. Each city would have at least 3 interesting neighborhoods. This can lead to 9 neighborhood analyses if you choose 3 cities. Having to do so many neighborhood analyses will lead you to decision paralysis. 

Try to do a neighborhood analysis on at least 2 cities. This will help you to be detached from one specific city you love. 

Have 2-3 cities ready? Then, read below to learn how to do neighborhood-level analysis! 

Neighborhood Analysis: How to choose the right property type? 

Once you’ve got the idea of 2-3 good markets to start an Airbnb, it’s time for you to do a more specific analysis. You need to find a good neighborhood and the right type of property. 

The outcome of this analysis is as below 

  1. 1) Top 2-3 most desirable neighborhoods for short-term rentals 
  2. 2) Best number of bedrooms (E.g. 3 or 4 bedrooms) 
  3. 3) Best property type (E.g. House with a pool) 

Finding the neighbourhoods.

Neighborhoods don’t have to be zipcodes or certain administrative divisions. It just refers to an area with a similar property price and Airbnb revenue. This can be determined by how close your place is from specific landmarks or many other ways. 

In the same market, different neighborhoods have different levels of demand. Starting in the right neighborhood goes a long way since you can’t change the neighborhood once you commit to it. This can be counterintuitive. There is a case where in-land properties have a higher occupancy rate than beachfront properties. After our analysis, we found out people like to stay near train stations for easier access to restaurants and public transport. 

How to? 

So, how can you find an area with high demand? You can use the heatmap feature from the Airbtics app. Dark red represents an area with a high occupancy rate. You can change the color to represent a number of listings or year-over-year change in occupancy. This will give you where are the hotspots and with a high demand.

airbnb occupancy rate heatmap

Number of bedrooms

First of all, it depends on your budget. Are you looking for a big size or a small size property? 

Then, take a closer look at occupancy rates and the number of listings per number of bedrooms. A certain number of bedrooms may do better than the other. Keep in mind – the number of bedrooms is one of the most important factors for Airbnb guests. 

Here, write down on your worksheet about average yearly revenue of different sizes of bedrooms. This will give you a good guide once you start looking at different properties for sale. 

Neighbourhood A (Airbnb yearly revenue) 

  • 2 bd: $85,000 
  • 3 bd:  $92,000
  • 4 bd: $135,000

Neighbourhood B (Airbnb yearly revenue) 

  • 3 bd: $59,000
  • 4 bd: $70.000
  • 5 bd: $92,000

Type of property: 

Take a look at the top properties in each of the neighborhoods. What do they look like? 

Firstly – is it a condo or a standalone house? 

Secondly – what other characteristics? 

It might be a wood cabin or a tiny house or a condo with many amenities. Note this down in your worksheet. 


How to? 

You can achieve this by using the Airbtics app. There is a section called “Top properties”. This section shows the top-performing properties in a specific neighborhood that you see on the map.  

Ensure your data is accurate 

Your entire market research should not depend on a single data source unless it is from an official source. 

For Airbnb revenue data, there is no officially available data anywhere. If you are using the Airbtics app, it’s a good idea to cross-check with other data platforms’ free data. Check if the occupancy rate or yearly revenue is similar in multiple data sources. If yes, the data you are using should be fine. If they all show very different numbers, you may have to check further. Go and check the Airbnb website and review the listings. Ask realtors or hosts in the area.


Review of best Airbnb markets available online 

Data source: Airbtics, 2022 Nov – 2023 Oct data. 

Sedona, AZ 

  • Occupancy rate – 68 %
  • Daily rate –  $235
  • Yearly revenue –  $32,116
  • Number of listings – 1,116

Santa Fe, New Mexico 

  • Occupancy rate –  74%
  • Daily rate –  $196
  • Yearly revenue – $55,174
  • Number of listings – 1,318

Savannah, GA 

  • Occupancy rate – 67%
  • Daily rate – $189
  • Yearly revenue – $29,674
  • Number of listings – 2,597

Barcelona, Spain 

  • Occupancy rate – 88%
  • Daily rate – €128
  • Yearly revenue – €10,591
  • Number of listings – 13,829

Bourne, MA 

  • Occupancy rate – 68%
  • Daily rate – $284
  • Yearly revenue – $59,251
  • Number of listings – 23

Colorado Springs, CO 

  • Occupancy rate – 70%
  • Daily rate – $121
  • Yearly revenue – $32,502
  • Number of listings – 2,492

Dallas, TX 

  • Occupancy rate – 59%
  • Daily rate – $124
  • Yearly revenue – $8,863
  • Number of listings – 5,0525

Eureka, IL 

  • Occupancy rate – 55$
  • Daily rate – $80
  • Yearly revenue – $19,010
  • Number of listings – 11

London, United Kingdom 

  • Occupancy rate – 82$ 
  • Daily rate – £236
  • Yearly revenue – £16,812
  • Number of listings – 4,432

Melbourne, Australia 

  • Occupancy rate – 66%
  • Daily rate – A$196
  • Yearly revenue – A$17,641
  • Number of listings – 20,327

Pascagoula, MS 

  • Occupancy rate – 48%
  • Daily rate – $124
  • Yearly revenue – $24,355 
  • Number of listings – 26

Rome, Italy 

  • Occupancy rate – 96%
  • Daily rate – €129
  • Yearly revenue – €17,033
  • Number of listings – 22,863

Salt Lake City, UT 

  • Occupancy rate – 71%
  • Daily rate – $98
  • Yearly revenue – $27,401
  • Number of listings – 1,845

Vancouver, Canada 

  • Occupancy rate – 85%
  • Daily rate – C$182
  • Yearly revenue – C$53,282
  • Number of listings – 5,361

Conclusion 


Here’s a recap. The goal of this market research is to find the best cities for you to start an Airbnb. You’ll start with 10 cities you like to consider starting an Airbnb. You’ll select 2-3 cities based on appreciation factor, STR regulation, and yearly rental yield. After this, you’ll do a more specific neighborhood-level analysis. 


Now, this is it! You have 2-3 cities. You have 2 neighborhoods in each city with the best number of bedrooms and type of properties. Use this knowledge to search for properties for sale. Let the realtors know about your criteria. Go and visit the properties for sale. 


It’s a good idea to tweak a little on this framework so that it makes more sense to you. Best luck! 


Categories
Airbnb Occupancy All About Airbnb

Airbnb Occupancy Rate Tool – Check Occupancy Data for Any Markets

Instantly See An Average Airbnb Occupancy Rate

Discover 30+ Airbnb statistics of any city worldwide!

What Is Occupancy Rate?

It is the percentage of nights booked among the available nights on an Airbnb listing. How can you find the average occupancy rate of your market? 

How to find Airbnb Occupancy Rates?

Simply enter an address above, and it’ll show you the average occupancy rate of any address in the world for free! The average occupancy rate is calculated by 10-20 similar listings around the input addresses.

What Is a good Occupancy Rate?

We provide a simple guide: “70% is considered a good year-round occupancy rate.” About 20% of markets worldwide fall under this category. 

How does Airbtics collect this data?

As a short-term rental data company, we’ve been tracking Airbnb listing occupancy rates and bookings since 2019. This allows us to have comprehensive Airbnb statistics at listing level. 

Those statistics includes:

Why do you need to know the Airbnb Occupancy Rate?

Market Research: Starting on your Airbnb venture? Knowing the Airbnb rates in your area will steer you in the right direction. 

The two most important factors are 1) choosing the perfect location with the highest average occupancy rate and 2)  determining the right number of bedrooms because you can’t change these two once you commit to a property. 

If you want to know the right location, simply use Airbtics’ Airbnb Occupancy Rate map. 

Airbnb Occupancy Map

Get more bookings: Knowing the peak season allows you to maximize your profit by charging higher fees. During low season, you can consider giving a discount for long-term rates, or it might be the right timing for you to use it as your vacation home! 

Airbnb Occupancy Rate

4 Interesting AirBNB Occupancy Rate Facts

Are you thinking of investing on short-term rentals or already have a few? These are some Airbnb Occupancy rate statistics that can be useful for you to know to get more bookings. 

Summary: Take professional photos, get more reviews – at least 5 reviews, be a super host to maximise your occupancy rates! 

Average Airbnb Occupancy Rates by City (US)

  • Fort Collins Airbnb Active Listing: 2,533  Average Airbnb Occupancy Rate (2023): 68% Peak Season: July
  • Seattle Airbnb Active Listing: 5,791 Average Airbnb Occupancy Rate (2023): 76% Peak Season: July
  • Memphis Airbnb Active Listing: 1,488 Average Airbnb Occupancy Rate (2023): 58% Peak Season: April 
  • Milwaukee Airbnb Active Listing: 1,552 Average Airbnb Occupancy Rate (2023): 60% Peak Season:  July
  • Ontario, NY Airbnb Active Listing: 632 Average Airbnb Occupancy Rate (2023): 56% Peak Season: July
  • Phoenix Airbnb Active Listing: 7,600 Average Airbnb Occupancy Rate (2023): 60% Peak Season: March
  • Austin Airbnb Active Listing: 10,779 Average Airbnb Occupancy Rate (2023): 61% Peak Season: April
  • San Antonio Airbnb Active Listing: 5,290 Average Airbnb Occupancy Rate (2023): 57% Peak Season: July
  • Newark, NJ Airbnb Active Listing: 1,480 Average Airbnb Occupancy Rate (2023):  60% Peak Season: September
  • Houston Airbnb Active Listing: 10,263 Average Airbnb Occupancy Rate (2023): 56% Peak Season: July
  • Fresno Airbnb Active Listing: 1,830 Average Airbnb Occupancy Rate (2023): 54% Peak Season: July
  • Chicago Airbnb Active Listing: 6,634 Average Airbnb Occupancy Rate (2023): 66% Peak Season: July
  • New York Airbnb Active Listing:  10,048 Average Airbnb Occupancy Rate (2023): 72% Peak Season: June
  • Boston Airbnb Active Listing: 2,690 Average Airbnb Occupancy Rate (2023): 81% Peak Season: October
  • Gainesville, FL Airbnb Active Listing: 871 Average Airbnb Occupancy Rate (2023): 56% Peak Season: August
  • Nashville Airbnb Active Listing: 8,137 Average Airbnb Occupancy Rate (2023): 62% Peak Season: April
  • Miami Airbnb Active Listing:  8,533 Average Airbnb Occupancy Rate (2023): 61% Peak Season: March
  • Jacksonville Airbnb Active Listing: 8,874 Average Airbnb Occupancy Rate (2023): 59% Peak Season: March
  • Orlando Airbnb Active Listing: 1,351 Average Airbnb Occupancy Rate (2023): 64% Peak Season: March
  • Denver Airbnb Active Listing: 4,595 Average Airbnb Occupancy Rate (2023): 77% Peak Season: June
  • Pittsburgh, PA Airbnb Active Listing:  2,195 Average Airbnb Occupancy Rate (2023): 63% Peak Season:  July
  • Wichita, KS Airbnb Active Listing: 683 Average Airbnb Occupancy Rate (2023): 60% Peak Season: July
  • Kansas, MO Airbnb Active Listing: 3,433 Average Airbnb Occupancy Rate (2023): 61% Peak Season: July
  • Tampa Airbnb Active Listing:  3,820 Average Airbnb Occupancy Rate (2023): 62% Peak Season: March
  • Raleigh Airbnb Active Listing: 1,504 Average Airbnb Occupancy Rate (2023): 63% Peak Season: July
  • Baltimore Airbnb Active Listing: 1,769 Average Airbnb Occupancy Rate (2023): 58% Peak Season: June

Average Airbnb Occupancy Rates by City (Canada)

  • Toronto
    Airbnb Active Listing: 12,637 
    Average Airbnb Occupancy Rate (2023): 77 %
    Peak Season: September

  • Calgary
    Airbnb Active Listing: 5,290
    Average Airbnb Occupancy Rate (2023): 77 %
    Peak Season: July

  • Quebec
    Airbnb Active Listing: 1,443
    Average Airbnb Occupancy Rate (2023): 76 %
    Peak Season: July & August

  • Edmonton
    Airbnb Active Listing: 2,954
    Average Airbnb Occupancy Rate (2023): 69 % 
    Peak Season: July

  • Montreal
    Airbnb Active Listing: 7,605 
    Average Airbnb Occupancy Rate (2023): 74 %
    Peak Season: August

  • Vancouver
    Airbnb Active Listing: 5,478
    Average Airbnb Occupancy Rate (2023): 85 %
    Peak Season: June-August

  • Winnipeg
    Airbnb Active Listing: 1,588
    Average Airbnb Occupancy Rate (2023): 69 % 
    Peak Season: July

  • Kitchener
    Airbnb Active Listing: 793
    Average Airbnb Occupancy Rate (2023): 69% 
    Peak Season: September

  • Victoria
    Airbnb Active Listing: 1,267
    Average Airbnb Occupancy Rate (2023): 79 %
    Peak Season: July & August

  • London, ON
    Airbnb Active Listing: 830
    Average Airbnb Occupancy Rate (2023): 66 %
    Peak Season:  September

  • Halifax
    Airbnb Active Listing: 1,238
    Average Airbnb Occupancy Rate (2023): 84 % 
    Peak Season: July & August

  • Sudbury
    Airbnb Active Listing: 352
    Average Airbnb Occupancy Rate (2023): 67%
    Peak Season: April

  • Kingston
    Airbnb Active Listing: 453
    Average Airbnb Occupancy Rate (2023): 70 %
    Peak Season: August

  • Ottawa
    Airbnb Active Listing: 2,248
    Average Airbnb Occupancy Rate (2023): 69 %
    Peak Season: July

Average Airbnb Occupancy Rates by City (Australia)

 
  • Adelaide
    Airbnb Active Listing:  3,782
    Average Airbnb Occupancy Rate:  73 %
    Peak Season:  April

  • Perth
    Airbnb Active Listing: 5,312
    Average Airbnb Occupancy Rate: 87 %
    Peak Season: April

  • Canberra
    Airbnb Active Listing: 1,738
    Average Airbnb Occupancy Rate: 73%
    Peak Season: April

  • Newcastle
    Airbnb Active Listing: 1,125
    Average Airbnb Occupancy Rate: 62%
    Peak Season: January

  • Melbourne
    Airbnb Active Listing: 20,327
    Average Airbnb Occupancy Rate:  66 %
    Peak Season: April

  • Brisbane
    Airbnb Active Listing: 3,901
    Average Airbnb Occupancy Rate: 85 %
    Peak Season: July

  • Sydney
    Airbnb Active Listing: 11,732
    Average Airbnb Occupancy Rate: 79% 
    Peak Season: April

  • Darwin
    Airbnb Active Listing: 1,110
    Average Airbnb Occupancy Rate: 69%
    Peak Season: August

  • Wollongong
    Airbnb Active Listing: 855
    Average Airbnb Occupancy Rate: 64%
    Peak Season: January

  • Hobart
    Airbnb Active Listing: 1,057
    Average Airbnb Occupancy Rate: 72%
    Peak Season: April

  • Toowoomba
    Airbnb Active Listing: 303
    Average Airbnb Occupancy Rate: 75%
    Peak Season: April

  • Central Coast
    Airbnb Active Listing: 2,598
    Average Airbnb Occupancy Rate: 43%
    Peak Season: January

  • Ballarat
    Airbnb Active Listing: 510 
    Average Airbnb Occupancy Rate: 510
    Peak Season: April

  • Greater Bendigo
    Airbnb Active Listing: 484
    Average Airbnb Occupancy Rate: 60%
    Peak Season: April 

Average Airbnb Occupancy Rates by City (UK)


  • London
    Airbnb Active Listing: 4,000
    Average Airbnb Occupancy Rate: 87%
    Peak Season: June & July

  • Edinburgh
    Airbnb Active Listing: 6,857
    Average Airbnb Occupancy Rate: 91%
    Peak Season: June- September

  • Liverpool
    Airbnb Active Listing: 3,376
    Average Airbnb Occupancy Rate: 57%
    Peak Season: April

  • Manchester
    Airbnb Active Listing: 2,338 
    Average Airbnb Occupancy Rate: 66%
    Peak Season: July

  • Glasgow
    Airbnb Active Listing: 2,329
    Average Airbnb Occupancy Rate: 76%
    Peak Season: 76%

  • Leeds
    Airbnb Active Listing: 1,465 
    Average Airbnb Occupancy Rate: 65%
    Peak Season: July

  • York
    Airbnb Active Listing: 1,730
    Average Airbnb Occupancy Rate: 66%
    Peak Season: July

  • Birmingham
    Airbnb Active Listing: 2,762
    Average Airbnb Occupancy Rate: 61%
    Peak Season: July

  • Nottingham
    Airbnb Active Listing: 1,212
    Average Airbnb Occupancy Rate: 61 %
    Peak Season: September

  • Bristol
    Airbnb Active Listing: 2,299
    Average Airbnb Occupancy Rate: 77 %
    Peak Season: September

  • Sheffield
    Airbnb Active Listing: 1,114
    Average Airbnb Occupancy Rate: 61%
    Peak Season: July

  • Cardiff
    Airbnb Active Listing: 1,880
    Average Airbnb Occupancy Rate: 60%
    Peak Season: July

  • Aberdeen
    Airbnb Active Listing: 725
    Average Airbnb Occupancy Rate: 70%
    Peak Season: July

  • Belfast
    Airbnb Active Listing: 1,446 
    Average Airbnb Occupancy Rate:  74%
    Peak Season:  74%

Average Airbnb Occupancy Rates (Top 50 Global Cities)


  • Amsterdam, Netherlands
    Airbnb Active Listing: 5,778
    Average Airbnb Occupancy Rate: 96%
    Peak Season: April- September

  • Athens, Greece
    Airbnb Active Listing: 11,223
    Average Airbnb Occupancy Rate: 79%
    Peak Season: June & September

  • Atlanta City, USA
    Airbnb Active Listing: 6,224
    Average Airbnb Occupancy Rate: 56 %
    Peak Season: July

  • Auckland, New Zealand
    Airbnb Active Listing: 5,026
    Average Airbnb Occupancy Rate: 77 %
    Peak Season: December

  • Austin, Texas
    Airbnb Active Listing: 10,779
    Average Airbnb Occupancy Rate: 61%
    Peak Season: April

  • Bangkok, Thailand
    Airbnb Active Listing: 14,532
    Average Airbnb Occupancy Rate: 55 %
    Peak Season: December

  • Barcelona, Spain
    Airbnb Active Listing: 13,829
    Average Airbnb Occupancy Rate: 88 %
    Peak Season: April, July & October

  • Batumi, Georgia
    Airbnb Active Listing: 4,564
    Average Airbnb Occupancy Rate: 49 %
    Peak Season: August

  • Beyoglu, Turkey
    Airbnb Active Listing:  7,891
    Average Airbnb Occupancy Rate: 61%
    Peak Season: October

  • Bogota, Colombia
    Airbnb Active Listing: 11,249
    Average Airbnb Occupancy Rate: 54 %
    Peak Season: July

  • Bordeaux, France
    Airbnb Active Listing: 4,369 
    Average Airbnb Occupancy Rate: 82%
    Peak Season: September

  • Berlin, Germany
    Airbnb Active Listing:  7,754 
    Average Airbnb Occupancy Rate: 87% 
    Peak Season: June & September

  • Brooklyn, New York
    Airbnb Active Listing: 8,858
    Average Airbnb Occupancy Rate: 79 %
    Peak Season: June

  • Budapest, Hungary
    Airbnb Active Listing:  9,741
    Average Airbnb Occupancy Rate: 79%
    Peak Season: July

  • Buenos Aires, Argentina
    Airbnb Active Listing: 24,453
    Average Airbnb Occupancy Rate: 70 %
    Peak Season: April

9 Simple Tips To Boost Your Airbnb Occupancy Rate

1. Choose the Right Airbnb Market

Finding the ideal Airbnb city or market is crucial in optimizing your occupancy rate. Look for popular destinations and analyze their Airbnb demand. These can positively affect your property’s visibility and desirability.

2. Search for the Best Submarket

Identify the most lucrative submarkets within your Airbnb city. A good Airbnb submarket includes the best neighborhoods, property types, and number of bedrooms. Targeting the specific preferences of potential guests in different areas can help you tailor your Airbnb to meet their needs and attract more bookings.

3. Add Some Amenities

Adding basic amenities such as towels, toilet paper, and wifi just meets guests’ expectations. However, going for an extra mile differentiates you from the rest. This may include adding a few small fancy Airbnb amenities, an Airbnb hot tub, or a swimming pool.

4. Furnish your Rental

Don’t skimp on quality furnishings because they will make your rental stand out. A thoughtfully designed and comfortable Airbnb is more likely to receive positive reviews and repeat bookings. Target the needs of your guests then create a welcoming environment conducive to longer stays.

5. Take Nice Photos

First impressions matter. Photos are worth a thousand words. Lure your guests with your property’s features captured in the best light. Showcase each room from different angles and center your rental’s unique aspect. While you can pick up some Airbnb photo tips, opting for a professional photographer can significantly enhance the visual appeal of your listing.

6. Boost Your Listings Visibility

Optimize your listing for Airbnb and search engine algorithms. Use relevant keywords in your title and description to target potential guests. Regular calendar updates and quick responses to guests’ inquiries also improve your search ranking.

7. Enable Airbnb Instant Book

Active Airbnb Instant Book for a seamless booking experience. This attracts spontaneous travelers. Plus, Airbnb often prioritizes and boosts the listings with this feature. 

8. Aim To Be An Airbnb Superhost

Aspire to have a Superhost status by giving exceptional hospitality. The rewards can be outstanding. These include increased visibility that can lead to higher occupancy rates and earnings.

9. Consider Professional Airbnb Managers

Consider hiring professional Airbnb managers who specialize in optimizing property listings. Aside from doing the marketing side of your rental, these experts can also handle tasks from the pricing strategy to communication with guests. You can also hire them for property upkeep and maintenance. However, these services come at a cost usually with a commission-based pricing structure. 

In the below, I’ve compiled the occupancy rates of major cities in the US, UK, Australia, and Canada. (There’s also a bonus of 50 global cities too!)  


Categories
Airbnb Rental Arbitrage All About Airbnb

A beginner’s guide to Airbnb Arbitrage

A beginner’s guide to Airbnb Arbitrage: 4 steps to have a successful first Airbnb arbitrage property. What is Airbnb arbitrage? You rent a property from a landlord, furnish it, and list it on Airbnb. You earn more than what you pay to the landlord.
Airbnb arbitrage

Airbnb Arbitrage is amazing. You can start this as a side hustle, but you can scale this up to build enough wealth for you to achieve financial freedom.

You can start your first rental arbitrage unit in a matter of 1-2 weeks as long as you make right progress. Here are 3 key tasks you need to complete. 

Airbnb Arbitrage is amazing. You can start this as a side hustle, but you can scale this up to build enough wealth for you to achieve financial freedom. 

What is Airbnb arbitrage? You rent a property from a landlord, furnish it, and list it on Airbnb. You earn more than what you pay to the landlord. You can start this without your own property and with very little capital.

Is it legal? Mostly, yes. Agree with your landlord. Check Airbnb regulations in your city. Many cities allow Airbnb. 

You can start your first rental arbitrage unit in a matter of 1-2 weeks as long as you make right progress. Here are 3 key tasks you need to complete. 

1. Market research (Tip: Use Airbnb analytics to finish this in a few minutes) 

2. View properties & sign the contract (Tip: Use secret software to get access to landlord-approved properties for rent.)

3. Furnishing

Start with market research

Find the goldmine areas. Find an area with abundant available long-term rentals in the market. At the same time, travelers should love this area. In other words, It is a property with a huge pricing gap between long-term and short-term rental. 

Via market research, you must get an answer for the 3 things. 1) What’s the short-term rental rule there? 2) What area has some serious pricing gaps? 3) What type of properties? 

For example, when I started it in Liverpool, UK, I found there’s no city-wise regulation, but it depends on which building. Some buildings are strictly for residential but not all. The downtown area has very high short-term rental demand compared to long-term rental. I found out small Studio & 1-bed type flat in well well-maintained building is the most popular on Airbnb in the area.  

Regulation 

What sort of regulation does your city have? Is there a limit on how many days you can rent it out as a short-term rental? Do you need to get a short-term rental permit? Clear this out. Search on Google, and check out the local government website. 

Find high-demand neighborhoods 

You can use the heatmap feature from the Airbtics app. The intensity of color represents the guest’s demand. Therefore, the dark red areas have a high occupancy rate. This will show you the Airbnb hotspots. In my case, the downtown area is the only hotspot with many short-term rentals available. Find out rent estimate of neighbourhoods. 

Type of property

On the right side of the map, you can see the top-performing Airbnb listings in the area. Check out some of them and see which type of properties you could go after. 

You can think in terms of the number of bedrooms (e.g. Studio vs 2 bedrooms) and type of properties (e.g. high-rise, modern). 

Acquire your first property

Acquiring the first property may sound challenging, but your first landlord may accept your offer too. Most landlords are not too keen on short-term rentals. Their three main concerns are complaints from their neighbors, excessive wear and tear, and unable to collect monies from you.

The best way is to meet the landlords face to face and talk with them. Many landlords are open to this. Building the trust is the key. 

Here are a few pointers to convince the landlord for your first property.

  • Offer 5-10% higher rental fee 
  • Offer a higher amount of deposit 
  • Pay a few months rent in advance 
  • Monthly report on their property on property damages 
  • You’ll use noise monitoring software to quickly address situations in which neighbors may feel uncomfortable 
  • You’ll sign up for short-term rental insurance 

If you are in the US, then try out a software called Airvana. On their website, you can find properties for rent that the landlords have already approved for rental arbitrage. Airvana use Airbtics data to power their market intelligence side. 

Furnish your property

If this is your first property, start lean, and invest in better items as you make more money. For a 1-bedroom apartment, you can furnish a basic listing under $2,000. Providing a kitchen isn’t a must. 

For an Airbnb property, you need to choose your theme and color palette. This will drastically improve your listing on photos and attract short-term guests. 

Here are examples of basic amenities you need

  • Refrigerator 
  • Dining table and chairs 
  • Sofa 
  • Bed frame 
  • Mattress 
  • Pillows 
  • Linen 
  • Closet organizer 
  • Decorative items
furnish your property

We have an in-depth article on the Airbnb startup cost. Here’s an example of how you can furnish your listing from scratch with $3,300.

Publish an Airbnb Listing

It’s surprisingly easy to publish a listing. One can publish a listing in 30 minutes. Once you publish, potential guests can see your listing and start booking. 

The most important part here is to use really nice pictures of your Airbnb. If it’s your first time, hire a professional who has done this before in your area. Your listing doesn’t have any reviews so guests can only rely on your listing’s picture before making a reservation. 


 Start with renting out a room, not the entire property

Are you a student or just got your first job? One idea for you. Rent an entire property with 3-4 bedrooms. You can live in one of the rooms and rent out the rest of the rooms on Airbnb. I did this personally when I was living in London in the UK. My Airbnb guests covered my entire rent. When my parents visited me in London, I just blocked the calendars on Airbnb so that I could use the entire property for my family. This would have been not possible with a long-term tenant. 

This also taught me good lessons on how to operate an Airbnb business efficiently. 

Categories
Guides

3 Companies Providing Airbnb Historical Data. (+Top use cases)

Learn how you can get Airbnb historical data within specific markets and their common use cases from this article!

Home > Resources > Guides 

airbnb historical data

Learn how you can get Airbnb historical data within specific markets and their common use cases from this article!

I’m the founder and developer behind Airbtics, a pioneering Airbnb analytics firm established in 2019. I have witnessed various use cases of Airbnb historical data in shaping strategic decisions. Whether you’re an Airbnb host, vacation rental manager, hedge fund manager trading Airbnb stocks, or a destination marketing organization, you can leverage Airbnb historical data. I’ll explain them later in this post. 

How to get Airbnb historical data?

Airbnb doesn’t provide this. Some companies have been collecting data by monitoring Airbnb listings’ calendars at regular intervals.  

4 leading vendors are AirDNA, AllTheRooms Analytics, Mashvisor, and Airbtics. Through these platforms, users gain access to crucial metrics such as occupancy rates, daily rates, and revenue trends within specific markets. AirDNA offers data at a daily level. Meanwhile, AllTheRooms Analytics and Mashvisor offer insights with monthly granularity. At Airbtics, we stand out by providing data granularity up to a daily level, with records stretching back to 2021.

airbnb historical data

6 common Airbnb historical data use cases

1. Strategic Investment Decisions: You can identify the most profitable cities for Airbnb investments through historical data analysis. Insights from Airbtics and other platforms empower investors to identify high-growth markets.

2. Neighbouhood-Level Analysis: You can find the different average occupancy rates of various neighborhoods. If this is what you need, you’ll find Airbtics useful as the data on the app is dynamic. You can move around different neighborhoods and it’ll show the statistics of different areas. 

airbnb historical data

3. Smart Pricing Strategies: Are you a revenue manager? Monitoring competitor rates and trends enables hosts and property managers to optimize pricing. Historical data gives a clear picture of market dynamics, allowing for smart pricing adjustments. If this is what you need, Airbtics offers various custom data solutions for your company. 

4. Listing Optimization: Benchmark against top-performing listings to optimize your listings. Historical data helps you with actionable insights to enhance listing occupancy rates. For example, you may find an insight that all the top listings in Dallas are offering Hot Tubs.

5. Airbnb Stock price prediction: By analyzing the total number of booked nights in different cities, one can anticipate shifts in Airbnb prices. Historical data serves as a compass for navigating market trends.

6. User Demographics: Unique to Airbtics is the ability to decipher Airbnb user demographics, such as geographical origins. This insight enables better targeting of marketing efforts. This is useful for DMOs or local governments.

Pricing 

If you are looking for customized data, it’ll typically start from $500 or more. Otherwise, you can simply use their app, and see the historical data from their dashboards. It’ll cost you a maximum of $100 per market.  

3 things to consider when choosing Airbnb historical data vendor

To leverage historical data effectively, several crucial considerations come into play:

1. Data Quality: Relying on subpar data can lead to misguided decisions. Before diving in, utilize the free version of the app to test data quality and accuracy.

2. Data Delivery Methods: Does the platform offer data through APIs or CSV files? A seamless and efficient data delivery mechanism is essential for streamlined decision-making.

3. Granularity Matters: Data granularity impacts the depth of insights. Can you access data on a monthly or daily basis? Is the data available at a market or individual listing level? Tailoring data granularity to your specific needs is paramount.

Looking for an accurate Airbnb Analytics?

At Airbtics, precision is our hallmark. Our data granularity, accessible via API, extends to individual listings, ensuring the most comprehensive insights. We take immense pride in our 97% accuracy rate (We compared our total number of nights booked on Airbnb prediction to Airbnb’s financial report). 

Meet our enterprise customers

TechVestor

TechVestor is a short-term rental investment fund. They receive Airbnb performance data of various markets in the US on a monthly basis to do analysis on each markets. It helps them to stay ahead in the market by knowing the trends fast. For example, they may find out the top Airbnb listings in a market X have hot-tub using our data.

PropR

PropR is a data-driven short-term rental management company based in South Africa, and also expanding into Dubai and European markets with over 400 listings. They receive our Airbnb pricing data on a weekly basis to feed their custom pricing algorithm. Result? It works better than any other dynamic pricing tool in the market because all short-term rentals are unique. They don’t leave a single dime on the table when it comes to setting nightly rates!

Unlock Worldwide
Short-Term Rental Data
Find unsaturated neighborhoods with the highest occupancy history.

Unlock Worldwide
Short-Term Rental Data
Find unsaturated neighborhoods with the highest occupancy history.

Annual Airbnb Revenue in 인천 한국-kr

인천| 에어 비앤비 수익률 & 에어 비앤비 통계 & 에어 비앤비 데이터 분석 | 한국 인천 에어 비앤비 수익률 & 에어 비앤비 통계 & 에어 …

Read More →
Annual Airbnb Revenue in Clawson michigan, USA

Clawson, Michigan| Airbnb Market Data & Overview | USA Clawson, Michigan Airbnb Market Data & Overview USA Is it profitable to do Airbnb in Clawson, …

Read More →
Annual Airbnb Revenue in Joplin missouri, USA

Joplin, Missouri| Airbnb Market Data & Overview | USA Joplin, Missouri Airbnb Market Data & Overview USA Is it profitable to do Airbnb in Joplin, …

Read More →
Annual Airbnb Revenue in Mena arkansas, USA

Mena, Arkansas| Airbnb Market Data & Overview | USA Mena, Arkansas Airbnb Market Data & Overview USA Is it profitable to do Airbnb in Mena, …

Read More →
Annual Airbnb Revenue In Baguio Philippines

Baguio| Airbnb Market Data & Overview | Philippines Baguio Airbnb Market Data & OverviewPhilippines Is it profitable to do Airbnb in Baguio, Philippines? What is …

Read More →
Annual Airbnb Revenue in Milford delaware, USA

Milford, Delaware| Airbnb Market Data & Overview | USA Milford, Delaware Airbnb Market Data & Overview USA Is it profitable to do Airbnb in Milford, …

Read More →

Categories
All About Airbnb Hosting Tips

Exclusive Black Friday Deals for Airbnb hosts Limited time only!

5 Markets - Standard Plan Deal for New Users: Before $149 | Black Friday Coupon: BF2022 Only for $299

  • Get full access to 5 regions’ data for only $99 for a limited time. The dashboard presents a region’s emerging markets and simulates cash returns using an Airbnb income calculator, along with weekly data updates, and historical performance data.
  • Airbnb hosts and property managers can easily discover accurate data for 5 regions – anywhere in the world!

Duration: December 03, 2022

Offer: 33% discount valid for 1 month

Payment: 

Option1. Go to this link and make a payment. Our customer onboarding team will reach out to provided email within 1 working day. https://buy.stripe.com/8wM4iN1Cs1h158cfZT

Option 2, Go to the app, click + button on the top right side to go to the payment page. Put BF2022 on checking out. 

COUPON CODE: BF2022

Discover Emerging Markets: Occupancy Rates, Daily Rates, Seasonality, and more

  • Simulate your Cash Return
  • Define Competitive Sets to Track and Benchmark
  • Achieve MORE PROFIT for your next investments!
Categories
All About Airbnb Hosting Tips

Exclusive Black Friday Deals for Airbnb hosts Limited time only! (Current Subscribers only)

30 Markets - Enterprise Plan Deal for Existing Users: Before $599 | Black Friday Coupon: Only for $299

  • Full dashboard access to 30 markets with 12 months of historical data of up to 600,000 short-term rentals.
  • Consult with our team for an exclusive property sourcing service giving you at least 5 high-income potential property deals based on your preferred markets.
  • See full details here

Duration: December 03, 2022

Offer: 50% discount valid for 1 month

Payment: https://buy.stripe.com/6oEbLf5SIf7R8kofZU

You will be able to enjoy our enterprise subscription at $299/mo (typically $599/mo). You will get a full-refund to your current subscription (either $149.95/mo or $74.95) once you made the payment to the above link within 1 working day. 

Our customer onboarding team will reach out via provided email within 1 working day.

Upgrade to Enterprise for 50% OFF & receive at least 5 property deals NOW

 Discover Emerging Markets: Occupancy Rates, Daily Rates, Seasonality, and more

  • Simulate your Cash Return
  • Define Competitive Sets to Track and Benchmark
  • Achieve MORE PROFIT for your next investments!
  • Did you know that we recently sourced high-income potential properties for our clients?

One of our clients wanted to expand their Airbnb business to Spain and Portugal, hence they upgraded to our Enterprise Plan and we started working with them to find the properties and the realtors to contact based on their budget and ROI goals!


Check out the sample of what you’ll get for this Enterprise plan:

Click here to check out the second property for sale

Free Webinar

Learn Airbtics in 7 Minutes

Revenue and market analysis Tips and Best Practices!
Airbnb Data
Airbnb Data

ARE YOU IN?

Get Access to our weekly data-driven airbnb report!