fbpx
🎉 FREE WEBINAR - July 24th, 11am / 8pm CET - Learn Airbtics in 7 Minutes - Revenue and Market Analysis Tips and Best Practices!
Categories
Guides

Airbnb Investment Sourcing As A Service

What is property sourcing by Airbtics?

It is a free service for our Enterprise subscription users ($599.95/mo). Our team of data analyst and real estate expert will identify & vet high return Airbnb investment opportunities for you. 

You can expect to receive at least 5 deals with contact addresses of realtors. All deals will be personally selected by our analysts, and we will contact the realtors to understand the hidden costs and feasibility to do Airbnb. Finally, we will use our own data to ensure it will exceed 20% gross rental yield or 50% first year cash return with above 50% LTV mortgage. 

Currently, it is only available in the US, the UK and Spain. If you are from other areas, please let us know.

How does it work? 

Step 1
Once you subscribe to the Enterprise plan, an account manager will reach out to you in 1 working day. You will be asked to fill out a questionnaire to let us know about your property search criteria. (E.g. which areas, budget, mortgage availability etc).

Step 2
Our analysts will do the property search and use our own data to analyze the properties. We will keep you in the loop. 

How can I get started?

Step 1

Go to our app and sign up.

Step 2

Click the plus button located on the top bar.

Step 3

Select the Enterprise plan and complete the payment. Our relationship manager will reach out to you in 1 working day. 

Categories
Support Why Airbtics

Airbnb Rental Arbitrage Market Research 101

Here’s the objective of this blog: To build a property search filter to accurately identify high-return rental arbitrage properties repeatedly. Being able to identify the right opportunities will help you to achieve the ultimate financial freedom by scaling your Airbnb business. 

How long does it take to build such filters? It will take about 10 minutes for you to evaluate 5 neighborhoods and build filters. 

Any major cities with more than 1 million in population or with more than 2,000 Airbnb listings are a good place to start if you don’t know where to start. Here’s our list for those cities in the US, UK, Canada, Australia, and Spain. If you aren’t living in any cities with the above criteria, you still can get started, but you may encounter problems in scaling later on.

Table of Contents
    Add a header to begin generating the table of contents

    Understanding the regulations 

    Different cities have different regulations, all of the above 150 cities are legally allowing to operate Airbnb business. However, you need to understand and master the rules and you need to plan the right approach. For instance, London (UK), only allows you to let out a residential property as a short-term rental for 90 days per calendar year. Tough! Still, there are a few ways to get around this – by renting it out as private rooms, filling the low season with mid-term bookings, and getting bookings from other channels.  

    You need the right mindset to start a business. There will be obstacles, but they should not stop you from building your Airbnb empire.

    Market Research – Neighborhood and Bedrooms

    The first step of your market research starts with identifying the average Airbnb (or short-term rental) revenues from various size and neighborhood combinations. For the explanation purpose, I will use the Bristol market as an example: BS1 (Bristol Downtown, UK) and BS8 (Clifton, UK).  

    Neighborhood

    Type of Bedrooms

    Average Rent Price (pcm)

    Airbnb Revenue

    Top 25%

    Rent – Revenue gap

    BS1

    1 bedroom

    £1,282

    £2,341

    £1,059

    BS1

    2-bedrooms

    £1,804

    £3,320

    £1,516

    BS1

    3-bedrooms

    £1,837

    £4,047

    £2,210

    BS8

    1-bedroom

    £1,039

    £2,517

    £1,478

    BS8

    2-bedroom

    £1,431

    £3,333

    £1,902

    BS8

    3-bedrooms

    £1,858

    £4,976

    £3,118

    The purpose of building this table is for you to understand which bedroom and neighborhood combination has good rental arbitrage opportunities on average. You can focus on areas with the big gap between average rent price and average Airbnb revenue. 

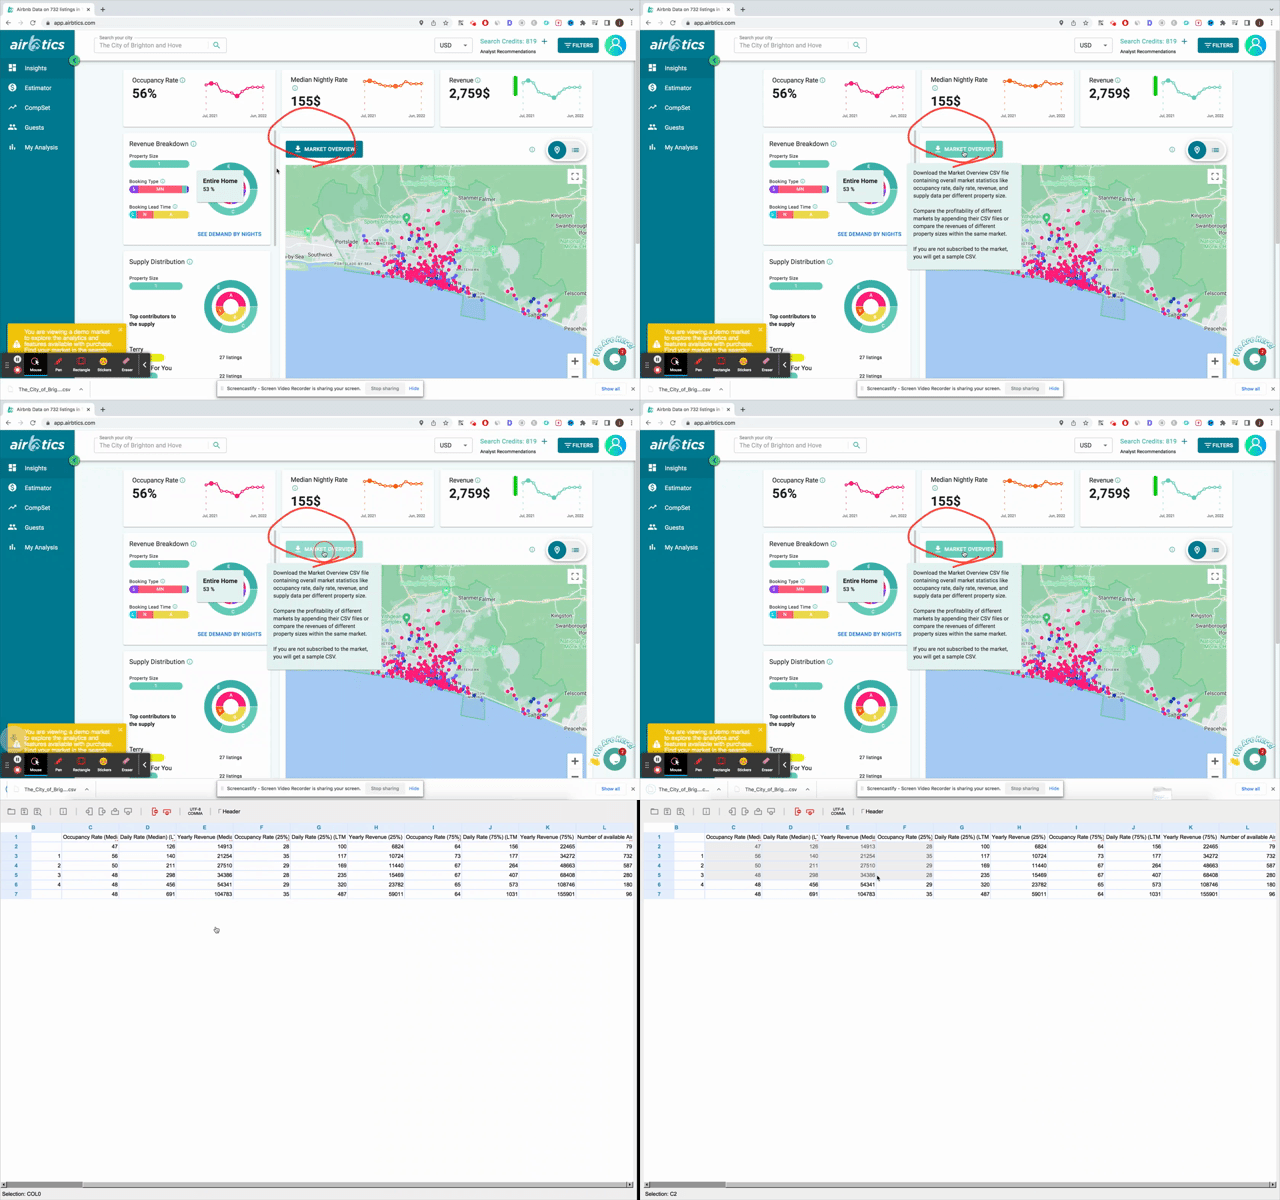
    How do you build this dataset? It is very simple. Go to our market research app, and search for your market, and click the “market overview” button. It’ll generate a CSV file with Airbnb revenue of different bedrooms in a click. You can repeat the process with a few zip codes or neighborhoods, then you will have a clear idea of what type of bedrooms and where are profitable. 

    *For average rent price, you can get the data from property websites like Zillow, or simply, find 5 properties for rent in that neighborhood and get the average.  


    how much can you make on airbnb

    Build a property search filter for rental arbitrage

    Now you have ideas on which areas have good profit potential. It’s time for you to build a property search filter. Creating this allows you to identify profitable properties at scale. 

    A property search filter has 3 criteria 1) rental price 2) location and 3) size. This is the filter you will use to find properties for rent. For the rental price, you should use the average rent price you used above, but you can adjust it depending on your situation. 

    Here is an example

    • A 3-bedroom apartment in BS8 for under £1850 per month. 

    Once you set the filter, you can go to Zillow, find all properties that match your criteria, and contact the owners to learn more about the properties before sending offers to them. These properties are supposed to give you a high return. 

    That’s it! 

    Airbtics
    Categories
    Airbnb Investment All About Airbnb

    Florida Airbnb Rental Yield data

    Florida Rental Yield Hotspots

    Airbnb & Short-term rental market data on the best rental yields in Florida

    • Click the city name to see detailed market data. 
    • Used Home Values data from Zillow to calculate Gross Rental Yields.
    • Used 1-bedroom Airbnb revenue data from Airbtics App.
    House Price Annual Revenue Airbnb Occupancy Rate Average Yield
    Miami $338,450 $48,342 58% 14.28%
    Fort Lauderdale $279,341 $28,490 57% 10.20%
    St Augustine Beach $248,883 $32,579 59% 13.09%
    Jacksonville Beach $314,580 $37,808 52% 12.02%
    Orlando $155,167 $30,559 52% 19.69%
    Tampa $235,172 $30,375 55% 12.92%
    Clearwater $157,067 $30,820 57% 19.62%
    Fort Myers $155,216 $12,398 47% 7.99%
    Key West $705,980 $140,878 57% 19.95%
    St Petersburg $175,035 $26,452 54% 15.11%

    Available Dataset for purchase

    Categories
    Airbnb Investment Blog posts

    Airbnb Calculator | Host Profit Estimator

    Airbnb Calculator

    Instantly See Your Airbnb's Estimated Revenue

    The leading Airbnb profit calculator in the short-term rental industry. Discover your Airbnb earnings potential.

    Trusted by 50,000+ Short-Term Rental Businesses
    Logo 1
    Logo 2
    Logo 3
    Logo 4
    Logo 5
    Logo 6
    Logo 7
    Logo 8
    Logo 9
    Logo 10
    Logo 11
    Logo 12
    Logo 13
    Logo 14
    Logo 15
    Logo 1
    Logo 2
    Logo 3
    Logo 4
    Logo 5
    Logo 6
    Logo 7
    Logo 8

    Check out our Free Airbnb Calculator

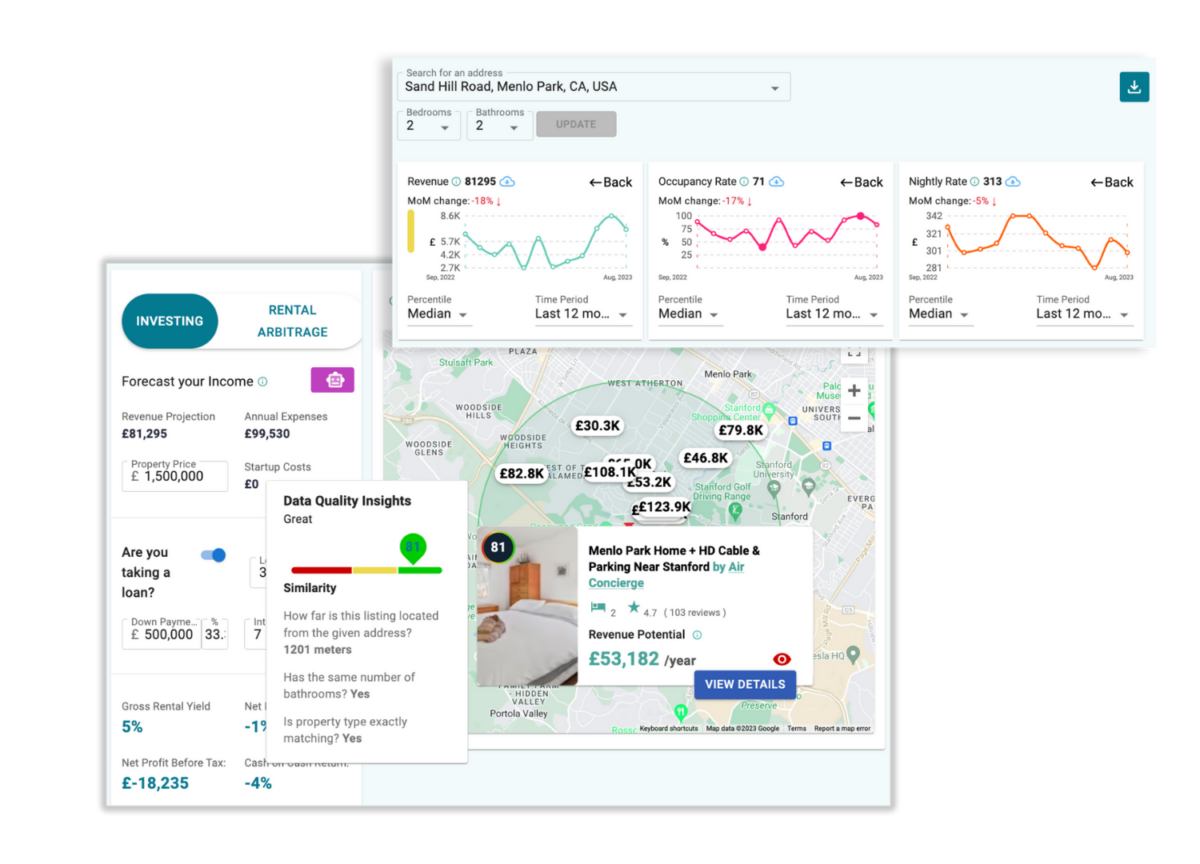
    Wondering how to make the most money from Airbnb? Use the Airbtics Host Profit Calculator, a free Airbnb calculator to simulate your return on investment and cash on cash return, with any address worldwide.

    Enter any address on earth to access the following data points for free with full transparency:

    Airbnb Calculator by Airbtics
    Airbnb Calculator

    How much can I make on Airbnb?

    A simple way to estimate your Airbnb revenue is by multiplying the year-round occupancy rate and your average daily rate of 10 Airbnb listings in your area. If they charge $150/night on average and achieve a 70% occupancy rate, it’s fair for you to assume that you will make around $150*0.70*365, which is $38,325 before expenses and taxes.

    Airbnb Occupancy Rate x Average Daily Rate x 365 = Your Airbnb Revenue

    Currently, there is a lack of good STR (short-term rental ) calculators in the market, and the ones that are available do not clearly show how they calculated the numbers. If you want to know how much can you make on Airbnb, then use Airbtics’ free Airbnb calculator to get a full transparent computation of your potential Airbnb earnings based on 10 to 40 comps.

    We believe that making data-based decisions should be easy and accessible for you. Whether you’re an Airbnb host, property manager, property investor, estate agent, or anything in between, access valuable data most relevant to you and your business. 


    Airbnb calculator - 2

    3 Tips to Use Your STR Calculator More Effectively

    1. Refine Comparable Listings: Review and remove comps that don’t match your property. Focus on those with reviews, close proximity, and similar property types to ensure accurate analysis.

    2. Pull Additional Comps: If needed, use the Airbtics calculator to pull 30 more comps. This provides a broader data set, enhancing your market analysis.

    3. Review Property Details: Check the details of each comp, including amenities, condition, and occupancy rates. This thorough review ensures a more accurate and insightful analysis.

    How Does Airbtics Estimate Rental Income?

    Airbtics is a short-term rental data platform providing historical, current, and forecasted rental income data. With the Airbtics app, you have access to over 15 million short-term rental listings from Airbnb and 54,000 visible markets globally. Since 2019, we’ve been tracking over 10 million rental properties weekly, which has enabled us to estimate rent of any address.

    Our free Airbnb calculator has nearly 9,000 active monthly users–from Airbnb investors, hosts, property managers, real estate agents, and anyone who wants to know rental income on Airbnb investment property. Here are simple steps to use it:

    We take our data accuracy seriously. Therefore, we update our data every week so our users can only get the fresh and latest Airbnb data from our app. Since 2020, the Airbtics data has 97% data accuracy in correlation with Airbnb’s financials. In fact, Awning’s Airbnb Estimator is powered by Airbtics. Learn more about our data accuracy..

    Enter property address anywhere in the world

    Enter the property address, select property type, choose the # of bedrooms, # of bathrooms, and whether the property has a pool. The provided details enhance the accuracy in generating optimal Airbnb estimated revenue.

    You can also search directly in the Airbtics dashboard to calculate ROI of your property. All you need to do is to sign up for free.

    What’s unique about our Airbnb Rental Calculator?

    Our Airbnb profit calculator goes beyond the typical Airbnb calculators out there. With its notable features, you capture more insights to make smarter decisions.

    • Comps Transparency: Imagine you want to know how much money you can make from renting your house on Airbnb. This special tool not only tells you about houses nearby but also finds ones that are a lot like yours. That way, you can trust the information more and be sure you’re making a good choice for your rental.
    • Rental Arbitrage: This Airbnb calculator tells you how much money you’ll earn in Airbnb arbitrage by looking at things like how much you pay for rent, one-time costs, and monthly expenses. It helps you know if renting your place is a smart money move.
    • Mortgage Calculation: Let’s say you borrowed some money to buy your house, and you’re wondering if it’s a good deal. This free Airbnb estimator lets you put in the details, like how much interest you’re paying and how much you put down. It’s a calculator that helps you see if your house is making you money or not.
    • Comparison Tool: This free Airbnb tool is like having a magic way to see lots of different houses all at once. It helps you pick the best one by showing you how much money you can make, whether it’s all the money or just what’s left after paying bills. It helps you choose the one that will give you the most money. So, it’s like your money-making assistant!

    Airbnb Investment FAQs

    Is Investing in a vacation rental worth it?

    Many studies have proved that housing is one of the most stable assets with a high average annual return. Note the annual return consists of home value appreciation and rental yield. By doing a vacation rental, you are renting it out for a shorter period at a higher price. This comes with a higher risk and seasonality, but the return is always higher. 


    Are you investing in a good market? Have population, income, and property prices been inclining last couple of years? Is there good long-term rental demand? if so, you can always turn your vacation rental into a long-term rental. 

    Where do I find short-term rental investment properties for sale?

    Airbtics, Rabbu, The Offer Sheet, AirDNA, and Mashvisor are known companies providing property for sale data nationwide. All companies only provide such services to US investors, with the exception of Airbtics, which covers the UK, Australia, Canada, and European markets. Fill out the form below if you want to receive highly profitable deals. 

    Should I list my short-term rental property on VRBO?

    Airbnb is the biggest platform for booking vacation homes, but VRBO is more prevalent in some areas. Using our VRBO calculator, you can see how many VRBO and Airbnb listings are in your address. See how many VRBO listings are there in your market.

    Airbnb Earning Calculator FAQs

    Which expenses should I include?

    Monthly Expense: You should include 1) repayment portion of mortgage 2) bills and utilities and 3) supplies fee. You should not include cleaning fees. Airbnb guests pay the cleaning fee, so it isn’t included in either ADRs or expenses. 

    Yearly Expense: You should include 1) property depreciation 2) any other annual recurring fees. 

    What is a one-off cost?

    One-off cost is a one-time expense (legal fees, refurbs, transaction fees, mortgage fees etc) you pay when purchasing property and paying for renovations. The one-off cost (combined with the down payment) is used to calculate Cash on Cash return

    I'm confused with profit tax

    In most countries, you need to pay taxes on any profit generated from your properties. However, the way they calculate tax isn’t a flat rate. For example, in the U.K., you won’t have to pay tax on a certain amount of profit at first. 

    In that case, you can first simulate the profit with 0% profit tax, which will then show you how much your revenue and expenses are. Then, you can calculate yourself around how much % of tax you need to pay from your profit, then put that % in the profit tax section. 

    Categories
    Airbnb Occupancy All About Airbnb

    Airbnb Analysis on Florida East Coast Beaches: Occupancy Rates, Best Neighbourhoods & more!

    Florida is the short-term rental heaven, one of the most touristy states in the US. If you are sick of the cold winter, operating a vacation home in Florida may be a good excuse to visit there every winter. Of course, all while generating profitable cash flow to sustain your mortgage fees and all. It’s also easy to get a permit to run an Airbnb business here, most counties are quite friendly to Airbnb hosts. 

    In this post, we’ll specifically showcase some of the important numbers you need to know if you want to start a vacation rental on the east coast side of Florida. The average 1 BD / BA condo in East coast Florida can generate $2,950. Their average occupancy rate is 52% and the average daily rate is $161 per night. 

    While this may sound enticing to Airbnb hosts who would like to invest their time and money, you have to keep in mind that some neighborhoods may not offer an equal amount of return on investment.

    The good news is that we’ve created this article to guide you through!

    Airbnb Statistics in Florida East Coast Beaches - 1 BD / 1BA Condo

    Collins avenue

    2021 Average occupancy rate: 54%

    2021 Median daily rate: $291

    2021 Average monthly revenue: $4714

    Miami Beach

    2021 Average occupancy rate: 55%

    2021 Median daily rate: $244

    2021 Average monthly revenue: $4322

    Downtown Miami

    2021 Average occupancy rate: 55%

    2021 Median daily rate: $240

    2021 Average monthly revenue: $4291

    American Beach

    2021 Average occupancy rate: 59%

    2021 Median daily rate: $196

    2021 Average monthly revenue: $3978

    Hollywood

    2021 Average occupancy rate: 56%

    2021 Median daily rate: $192

    2021 Average monthly revenue: $3668

    Sunny Isles Beach

    2021 Average occupancy rate: 59%

    2021 Median daily rate: $170

    2021 Average monthly revenue: $3533

    Jacksonville Beach

    2021 Average occupancy rate: 59%

    2021 Median daily rate: $170

    2021 Average monthly revenue: $3514

    Miami

    2021 Average occupancy rate: 55%

    2021 Median daily rate: $191

    2021 Average monthly revenue: $3422

    St. Augustine Beach

    2021 Average occupancy rate: 63%

    2021 Median daily rate: $147

    2021 Average monthly revenue: $3198

    Fernandina Beach

    2021 Average occupancy rate: 55%

    2021 Median daily rate: $123

    2021 Average monthly revenue: $3180

    South Ponte Vedra Beach

    2021 Average occupancy rate: 61%

    2021 Median daily rate: $135

    2021 Average monthly revenue: $2878

    Delray Beach

    2021 Average occupancy rate: 48%

    2021 Median daily rate: $176

    2021 Average monthly revenue: $2774

    Fort Lauderdale

    2021 Average occupancy rate: 54%

    2021 Median daily rate: $148

    2021 Average monthly revenue: $2744

    Neptune Beach

    2021 Average occupancy rate: 52%

    2021 Median daily rate: $147

    2021 Average monthly revenue: $2723

    Daytona Beach

    2021 Average occupancy rate: 49%

    2021 Median daily rate: $163

    2021 Average monthly revenue: $2720

    Ormond Beach

    2021 Average occupancy rate: 50%

    2021 Median daily rate: $153

    2021 Average monthly revenue: $2649

    Cocoa Beach

    2021 Average occupancy rate: 64%

    2021 Median daily rate: $111

    2021 Average monthly revenue: $2626

    New Smyrna Beach

    2021 Average occupancy rate: 49%

    2021 Median daily rate: $217

    2021 Average monthly revenue: $2620

    Butler Beach

    2021 Average occupancy rate: 58%

    2021 Median daily rate: $114

    2021 Average monthly revenue: $2613

    Wynwood

    2021 Average occupancy rate: 52%

    2021 Median daily rate: $166

    2021 Average monthly revenue: $2457

    Jupiter

    2021 Average occupancy rate: 38%

    2021 Median daily rate: $145

    2021 Average monthly revenue: $2288

    Near Miami Internatinoal airport

    2021 Average occupancy rate: 56%

    2021 Median daily rate: $134

    2021 Average monthly revenue: $2242

    West Palm beach

    2021 Average occupancy rate: 47%

    2021 Median daily rate: $122

    2021 Average monthly revenue: $2167

    Vero Beach

    2021 Average occupancy rate: 48%

    2021 Median daily rate: $118

    2021 Average monthly revenue: $2088

    Jensen beach

    2021 Average occupancy rate: 41%

    2021 Median daily rate: $158

    2021 Average monthly revenue: $2071

    Melbourne

    2021 Average occupancy rate: 53%

    2021 Median daily rate: $107

    2021 Average monthly revenue: $2039

    Playalinda Beach

    2021 Average occupancy rate: 49%

    2021 Median daily rate: $180

    2021 Average monthly revenue: $1577

    airbnb occupancy rates Florida

    Through this accurate & reliable information, you can compare each listing in order to strategize properly and answer the most important question: is it going to maximize your revenue in the long run, or not?

    Frequently Asked Questions

    You need to get a short-term rental permit by the Florida Department of Business and Professional Regulation (DBPR). However, according to our own Airbnb listing analysis, more than 50% of Airbnb listings in Florida didn't submit their license information to Airbnb. Pshhh…

    According to our data analysis, the first half of the year, January - June, has higher occupancy rates than the latter half of the year. However, the average nightly rate is higher during the latter half of the year.

    $251 per night in 2021. It's $191 for 1 bd / 1 ba condo. 

    If you are looking for the highest revenue, the coastline that is close to Miami beach is a good bet. For example, Collins Avenue, Miami Beach, Downtown Miami, and Hollowood have the highest average revenue for 1bd / 1 ba condos. 

    Cocoa Beach, St. Augustine Beach, South Ponte Vedra Beach, American beach, Jacksonville Beach, and Sunny Isles beach have an average occupancy rate of 59% or higher. 

    Zillow or Redfin has the most amount of properties available for sale. Alternatively, Vroilo and Awning are specialized vacation home online brokers. You can also speak with realtors in the areas. 

    First of all, having a pool will increase your RevPAR pretty efficiently. Our data says you will make 44% more, in the case of Miami, if your listing has access to a pool. Secondly, A hot tub can add about 42% of revenue. Making your listing pet-friendly will increase your RevPAR by 12% - is it worth all the deep cleaning you need to do? Up for you to decide!  

    Where is the best beaches in East Florida for short-term rental property investment?

    When it comes to picking high net rental yield investment properties, it’s less about the area but it’s more about the specific properties for sale that you choose. But the data analysis we are going to show could guide you on which areas to look at more carefully. it’s better to start in upcoming or undervalued areas.

    airbnb occupancy rates Florida

    So, this image shows that the property price tends to get higher in the Miami area, but interesting point here is that the property price isn’t that high in Jacksonville area, which has similar amount of average annual Airbnb revenue. This means there is a good chance that you can find a relatively cheap property up in the north east coast, and run an Airbnb to generate high cash return. 

    CANT SEE YOUR PREFERRED CITY IN FLORIDA?

    Check out the average Airbnb occupancy rates by city now! 

    If you are looking forward to running your Airbnb business in the long term, strategizing your occupancy & daily rates are just as important as maximizing your revenue.

    Thanks to technology, you can analyze all that using an accurate short-term rental analytics that can help you estimate your earnings!

    airbnb london revenue
    how much can you make on airbnb

    Airbnb Average Occupancy Rate in Florida East Coast Beaches - 1 BD / 1BA Condo

    airbnb occupancy rates Florida

    The above bar chart shows the 2021 average occupancy rates of 1 bedroom / 1 bathroom condo in each of the destinations.

    Having an estimated percentage of your occupancy rate is one of the most essential key performance indicators for hosts in the Airbnb business.

    This refers to the proportion of days in a month for which your property has bookings.

    Primarily, as seen on the bar chart, Cocoa Beach, St.Augustine Bech, South Ponte Vedra are the top 3 highly occupied destinations. Jupiter Beach, Jensen Beach and Vero Beach are not so doing well! Should you avoid them? Well, it depends, you might find a good deal in that city, or maybe it’s just the 1 bed / 1 bath condo that isn’t doing so well in these regions. You still need to do further analysis. 

    Categories
    Others

    에어비앤비 창업하기 가장 좋은 도시는? 수익률 알아보기 (제주, 서울 등등) 2022 최신버젼


    Table of Contents
      Add a header to begin generating the table of contents

      에어비앤비가 2008년에 생긴 이후로, 매해 마다 점점 더 많은 수의 호스트들이 에어비앤비를 통해 제태크 수입을 내고있습니다. 투잡으로 에어비앤비를 관리하는 사람들이 대부분이지만 에어비앤비를 통해 전문적인 사업을 하는 사람들도 많이 늘어나고 있는데요. 오늘 이 블로그에서는, 에어비앤비 데이터 분석을 통해, 국내에서 에어비앤비를 하기 가장 좋은 7개 지역을 뽑아 봤습니다. 


      이 글을 쓰기위해서 저희는 에어비틱스라는 호스트를 위한 에어비앤비 데이터 분석 플랫폼을 사용했습니다. 또한, 자신의 집이 에어비앤비를 하면 얼마나 수익을 낼 수 있는지도 한방에 알아 볼 수 있으니, 참조해주세요.

      에어비앤비 시작하기 좋은 수익률 높은 곳 7군데

      서울

      에어비앤비를 시작하기에 가장 좋지는 않지만 (비싼 집값으로인해) , 우리의 수도 서울부터 소개를 해드리겠습니다. 9000여개의 에어비앤비가 있네요. 에어비앤비를 통해 가장 수혜를 본 도시는, 기존의 유명한 관광지인 제주도 같은 곳이 아닌, 이미 많은 호텔들이 위치한 서울과 같은 도시입니다. 에어비앤비가 생기기 전에는, 호텔 혹은 모텔이 유일한 숙박 옵션이였는데요, 이제는 많은 도시민박이 생겨, 서울에 있는 아파트에서 며칠간 쉬며 서울거주민생활을 체험해볼수있습니다.

      서울내에서도 가장 핫한 곳은, 홍대입구역 근처입니다. 기존부터 많은 외국인을 위한 게스트하우스들이 있었던 점이 한몫을 한것 같습니다. 그 다음으로는, 한옥마을, 이태원근처, 강남역근처, 판교근처도 에어비앤비 하기가 좋습니다. 강남지역 보다는 강북지역이 에어비앤비를 하기 좋아 보이네요. 

      홍대입구역근처의 방이 한칸인 에어비앤비는 2021년 41퍼센트의 점유율을 보여줬구요, 한달 수입이 120만원 정도가 되네요. 이정도면 에어비앤비 할만한가요? 장기임대가 나은가요? 

      서울 에어비앤비 이용객의 대략 80프로는 내국인이구요, 20프로만 외국인입니다. 대부분의 외국인은 미국에서 오는 것으로 보이네요. 90퍼센트의 서울 이용객은 한국어를 쓰니, 제목을 쓸때도 참조하면 좋겠네요! 

      서울 에어비앤비 데이터 보기 

      제주시

      두번째로 소개해드릴 도시, 그리고 에어비앤비를 시작하기 가장 좋은 도시는, 제주도입니다. 5000여개의 에어비앤비가 있습니다. 제주도는 관광도시로 유명한 곳이죠. 


      제주도에서는 방한칸짜리 집이 평균적으로 한달에 190만원의 수익을 냅니다. 서울보다 낮은 집값이지만 수익률은 80프로이상 높네요. 점유율은 50프로를 상회하며, 1박 평균 11만원 이상을 받습니다. 청소비용으로는 15,000원 정도가 시세네요. 

      제주도 남부가 더 좋을까요 아니면 북부가 좋을까요? 알고싶으시다면 에어비틱스 데이터 보드를 확인해보세요. 


      제주 에어비앤비 데이터 보기

      강릉 속초

      세번째로 에어비앤비를 하기 좋은 도시는 서울에서 그리 멀지 않은 동해안 도시, 강릉과 속초입니다. 

      총 3,000 개의 에어비앤비가 있습니다. 속초,강릉,양양 인구수를 다 합해서 50만이 넘지 않는것에 비하면, 정말 많은양의 에어비앤비가 있네요. 또한 이곳은 코로나로인해 해외 관광을 못하게 되므로서, 더 많은 관광객들이 찾아오는 핫플레이스가 되어버렸습니다. 


      1년내내 점유율은 서울혹은 제주보다 작습니다. 하지만, 방한칸짜리 1일숙박료가 홍대보다도 비싼 평균 11만원입니다. 성수기인 여름에 좀더 높은 점유율을 보이지만, 12월 1월 크리스마스, 세해를 비롯한 각종 공휴일에도 인기가 많은 곳입니다. 


      개인적으로 생각하는 속초,강릉의 장점은 제주와는 달리 서울에서 2시간만 차를타고 갈 수 있기 때문에, 서울에서 일을하며, 투잡으로 속초,강릉에 있는 에어비애비를 관리하기 쉽다는 점이 있습니다. 

      속초 공유숙박 데이터보기

      강릉 공유숙박 데이터보기

      부산

      에어비앤비하면 도시민박이라고 앞서 말씀드렸는데요. 부산에는 2,500개의 에어비앤비가 있습니다. 부산 에어비앤비 창업의 매력은 강릉 혹은 제주와 같은 관광지이며 서울과 같은 대도시의 느낌을 주는 곳이라는것이 장점이라고 봅니다. 대도시이기때문에, 속초, 강릉 보다 약간 높은 37%라는 입실률을 보이고있습니다. 

      수영구의 마린시티에 있는 한 에어비앤비는 겨울시즌 동안에도 월 200가까이 벌어들였네요. 

      부산 에어비엔비 데이터보기

      경주

      신라시대의 수도. 한국의 문화재가 가득한 경주를 빼놓을 수가 없습니다. 800여개의 에어비앤비가 있으나, 입실률은 속초,강릉 보다 약간 낮은 정도입니다. 경주에 오는 대부분의 관광객은 예상을 했겠지만, 서울입니다. 그 다음으로는, 대구와 부산 그리고 울산에서도 경주에 찾아오네요.

      경주 에어비앤비 데이터보기

      전주

      그 다음으로 알아볼 도시는, 전주입니다. 한옥마을로 유명한 곳이죠. 전주의 에어비앤비 시장은 그렇게 크지는 않습니다. 1,000여개의 에어비앤비가 있습니다. 연중 입실률도 25프로정도로 생각만큼 매력적이지는 않습니다. 하지만, 전주 시내, 한옥마을 근처는 또 이야기가 다르겠죠? 

      전주 에어비앤비 데이터

      여수와 거제

      마지막으로 알아볼 도시 둘은 여수와 거제입니다. 각각 800여개의 에어비앤비가 있습니다. 혹시 남부 해안가에서 에어비앤비를 하고싶다면 유용한 정보인데요, 여수시가 거제시보다는 약간더 입실률과 수익률이 좋습니다. 

      거제시 에어비앤비 데이터

      여수시 에어비앤비 데이터

      이 블로그에서는 국내에 7군데의 에어비앤비 사업을 시작 하기 좋은 도시들을 알아봤습니다.

      Airbnb data
      Categories
      Airbnb Investment All About Airbnb

      Best Cities to start Airbnb Rental Arbitrage Business in the US.

      Best Cities to Start Airbnb Rental Arbitrage Business

      The pandemic has hit short-term rental businesses all over the world, but it’s not the case in the US. It’s backed by data that many of the remote US destinations have experienced the most profitable Summer in 2020 and are looking for another profitable Summer in 2021. So it might seem the world is falling apart and everything is going down. But the data is speaking otherwise, according to 2020 airbnb data this is a great time to start your STR journey. The market is about to bounce back as people are craving the outdoors. So to help you focus more on the important things in your STR journey, and not the boring research part, we have compiled a list of the best cities to start Airbnb in US.

      The Airbnb business is booming

      The rental arbitrage model is extremely attractive for hungry and motivated entrepreneurs. You don’t need much money to get started with your first rental. In fact, you can even start by renting out your own room (and you stay the night at your car or friend’s house) to save up the initial deposit to start your first arbitrage unit. However, the rental arbitrage won’t generate passive income – It’s not true passive income because you constantly need to pitch to landlords and manage day to day operations.

      Rental Arbitrage is booming
      dashboard of best cities to start airbnb

      What is Airbnb Rental Arbitrage?

      Maximize your rental property revenue with more inventory and dynamic pricing tools.

      Data-backed Market Research: You start with conducting thorough research about the market to find the profitable neighborhoods, amenities, and styles.  


      Pitch to landlords: Now you know the number and you know this property will generate profit for sure. It’s time to contact landlords to get permission to do rental arbitrage and get accepted.


      Efficient operation & Profit: A lot of hustles in putting your listings on various channels, right pricing, and many other tactics. Still, I trust that you will be able to learn along the way as long as you have started with the right properties. 

      man jumping

      How to identify profitable rentals for rental arbitrage?

      Make more informed decisions with the power of accurate data.

      short term rental data use case for property investors

      Definition of Arbitrage: In economics and finance, arbitrage is the practice of taking advantage of a price difference between two or more markets. 

      As the definition suggests, you need to find the gap between the “long-term rental market” and the “short-term rental market”. Fortunately, finding a long-term market base price is straightforward. You can easily find the market prices for the long-term rental market in Zillow. Finding the short-term rental market price is more difficult since looking at “daily rate” and “cleaning fees” on Airbnb isn’t enough because you also need to know “occupancy rates”. Therefore, the key to the success of rental arbitrage research is in short-term rental market research.

      Then, what is the “key” of short-term rental market research? It is basically clearly identifying the range of profit of properties in different neighborhoods and by the size of properties

      The profit consists of three variables – 1) occupancy rate, 2) average daily rate and 3) expenses. The size of properties is a little bit more complex as it consists of the “number of bedrooms, bathrooms, and the total number of beds”. I will go through different tools to find out the occupancy rate and daily rate of different neighborhoods a little bit later. 

      How much does it cost to start your first rental arbitrage?

      Stay up-to-date with relevant industry trends.

      Don’t panic. After all, the starting cost is quite predictable once you do enough research. 

      • Deposit 
      • First-month rent 
      • Furnishing (Beds, Sofa, Dishes etc) 
      • Supplies (Here’s a checklist)

      If I were you, I would start with basic furniture only – one mattress with a base and a cover per room, one used sofa, a pot, a pen, and plastic cutleries. Once I receive a few bookings, then, I will start investing more stuff like lamps, coffee pots, and so on. Starting with a huge budget will make you feel pressured to get a better return, so please be a minimalist when you get started. 

      Airbnb Analytics dashboard image

      Tips to do market research effectively and correctly

      Use competitive and intelligent data to your advantage.

      You need to make a comparison table to structure your research and efficiently search for your next properties. The template could look like below. 

      Profit before paying rent = (occupancy rate * daily rate) + cleaning fees (that you charged from guests) – cleaning fees (that you actually spent) – other expenses 

      Now you know the profit before paying rent, so now you can just identify which properties on Zillow can be profitable when you rent them. On Zillow, as of today (2021-06-20), there is only one property that can profit $500 a month to you.

      best cities to start airbnb - redwood

      How much does it cost to start your first rental arbitrage?

      Stay up-to-date with relevant industry trends.

      Now I guess you are wondering how much a short-term rental around your neighborhoods is making. 

      You can use our research tool to find it. You can choose one city, and if you zoom in to a specific neighborhood, it will show the average daily rate and occupancy rates from the short-term rentals on the map. 

      If you do research, you will find out that there are so many profit combinations (neighborhoods x property size). 

      Now let’s take a look at the best cities to start airbnb in the US.

      best cities to start airbnb - airbtics

      Best Cities to Start Airbnb in US

      To make it easy for you, below are some (not all) best cities to start Airbnb in the US that have possible profitable combinations for rental arbitrage. 

      There’s no point in giving you some numbers of expected rental arbitrage returns because it will be depending on the exact neighbourhood and the size of properties you are going to rent. Please do your thorough research to find out some areas where there’s a high demand for short-term rentals while having excessive long-term rental supplies. 

      San Antonio

      New York City

      Las Vegas 

      San Diego

      Chicago

      Miami

      Milwaukee

      Columbus

      Indianapolis

      Memphis

      Philadelphia

      Kissimmee

      Phoenix

      What's next?

      If you are doubtful about using data solutions, I’d recommend you to 1) speak to a property manager in your area 2) ask other Airbnb hosts in various Airbnb host’s communities 3) collect data on your own from Airbnb website. 

      If you are lost, you can find other Airbnb hosts from the following links. 

      Read More from me
      Rental Arbitrage Florida 
      AirDNA Review: Does it still hold up in 2021? 
      5 Short Term Rental Tools for Perfect Pricing

      Categories
      All About Airbnb Hosting Tips

      How to do Airbnb Pricing right in 2021 using vacation rental data?

      Pricing Short-term rentals correctly for this upcoming (2021) Summer became a challenging thing as the supply-demand of rentals in your market has never been like this before. This post describes how a revenue manager could use vacation rental data to price your listing efficiently. After reading the post, you will learn what type of vacation rental data is available and how accurate and useful it could be to your future pricing strategy. 

      So…what is the vacation rental data we are talking about here? The three widely used data for vacation rental revenue managers come from 1) their listings 2) from other property managers 3) from web scraped data.

      The fundamental Airbnb data you need for Airbnb Pricing

      Did you know that web scraped data can show 1) average daily rate 2) price year on year trend 3) seasonality 4) weekday vs weekend price 5) events and 6) other promotion prices? 

      Firstly, there is the baseline market price. It is the average booked nightly price of a specific market for a specific type of property. 

      Secondly, you need to know the trend derived from historical data. It can show you whether this market’s price has been increasing over years or decreasing. 

      Thirdly, seasonality. It is how a specific week or month is performing compared to other months. Does this market get more visitors in Summer than Winter? Then the nightly rate in Summer is probably higher than the winter given that the supply remains consistent throughout the year. 

      Fourth, the prices of the week of the day. The most typical pattern is that Friday and Saturday night has 10 – 50% higher prices than Sunday – Monday. But this can vary by market and type of property. 

      Fifth, the local events, holidays, and global events. You typically see these days booked in well advance with higher nightly rates. 

      Sixth, booking lead time. How many days in advance do nights get booked in this market? 

      Lastly, the promotion prices. This includes a special discount for long-term stays or a discount for unpopular days like Monday. 

      The dynamic Airbnb pricing data you need for Airbnb Pricing

      The pricing data changes every hour and knowing that can make you more competitive. These are the dynamic Airbnb pricing data you can get from web scraped data.

      Firstly, the last-minute pricing. Many Airbnb hosts or revenue management teams drop their prices if nights are not booked until the last minute. Knowing those prices can be useful information if you want to grab more bookings. Your competitors might have been monitoring your listings and taking the majority of bookings by just lowering $3-5/night than yours.  

      Secondly, recently made booking data. You can also get nearly real-time booking data (nearly because in the case of us, it takes somewhere between 1 – 23 hours to process the booking data). This gives you a good idea of what is happening in the market currently.

      How to do pricing right for this Summer?

      Your focus should be on the supply and demand of this year, not the previous years. Start with a general understanding of your market by looking at search volume data. This will give you a general idea about the demand of your market this year. So, let’s say if the summer in 2019 was 75% booked in your market, and the search volume has increased by 10%, you can expect around 82.5% of rooms will be booked this Summer if the supply remained constant. 

      Tip1. If your market won’t do well this year from the search data, you should probably lower your rates to get those few bookings. If your market does well, then, you should carefully design promotion strategies based on the expected booking lead time we will discuss below.

      STR on Airbnb is still allowed in NYC as long as you agree to share certain infromation with the city.

      The next thing you could do is tracking the summer occupancy rate of your market. Compare that with your “expected 2021 summer occupancy rate”, and once it hits 60-70% of the “expected 2021 summer occupancy rate”, you should start sending the promotional offers and discounts. In most markets, you can expect the 60-70% to be happening a lot later than 2019, since globally, the booking lead time has decreased significantly. However, this year, the booking lead time has been increased from the last year. 

      Tip2. If you are booked quicker than your market’s average booking lead time, you should consider raising the price, you are probably underpricing. Or, are you less booked than your competitors or market, maybe you should lower your price.

      How to get 2021 Summer Vacation Rental Data

      If you are resonating with the methods outlined above, it’s probably the best bet to contact us to get the data mentioned above. We will be able to deliver a daily pricing report of your market to your inbox every morning. 

      Categories
      Case Studies

      Increase your RevPAR by analyzing guest demands

      How to increase the daily rate of your Airbnb listing while keeping your occupancy rate? Our team has been doing a crazy experiment using Airbnb data for the last couple of months. We wanted to see if we can make Airbnb hosts charge 20-30% more daily rate while maintaining their occupancy rates and without investing a hefty fee. 


      We are a short-term rental analytics company processing 2 billion nights of Airbnb nights data every week and using this we were able to conclude that you can increase your daily rate and get the same amount of bookings, but by attracting different crowds and amending your offers. 


      These are the example of common daily rate driver

      • Pet-friendly 
      • Hot tub or Pool 
      • Family-friendly 
      • Remote worker-friendly 
      • Long-term stay friendly 
      • Parking 


      But the question is – how much of a higher daily rate can I increase by adding each of those services? A better question is, is there a way to identify this? 

      Good news! Our demand research tool shows you the daily rate comparison of listings with certain services or amenity VS without. This can be useful if you are thinking of doing a rental arbitrage or if you already own vacation homes but looking to boost your revenue for this Summer. 

       Here are some case studies. These graphs are screenshotted from our app. 

      Should I keep my strict cancellation policy?

      Case 1. San Antonio, TX. Does your rental have a strict cancellation policy and happens to be located in San Antonio? Sad news, your listing is expected to have 40% fewer bookings than the listings without. If you want to increase your RevPAR, you may want to reconsider your cancellation option.

      How airbnb cancellation policy affect your occupancy rate?

      Should I make my Airbnb mid-term stay friendly?

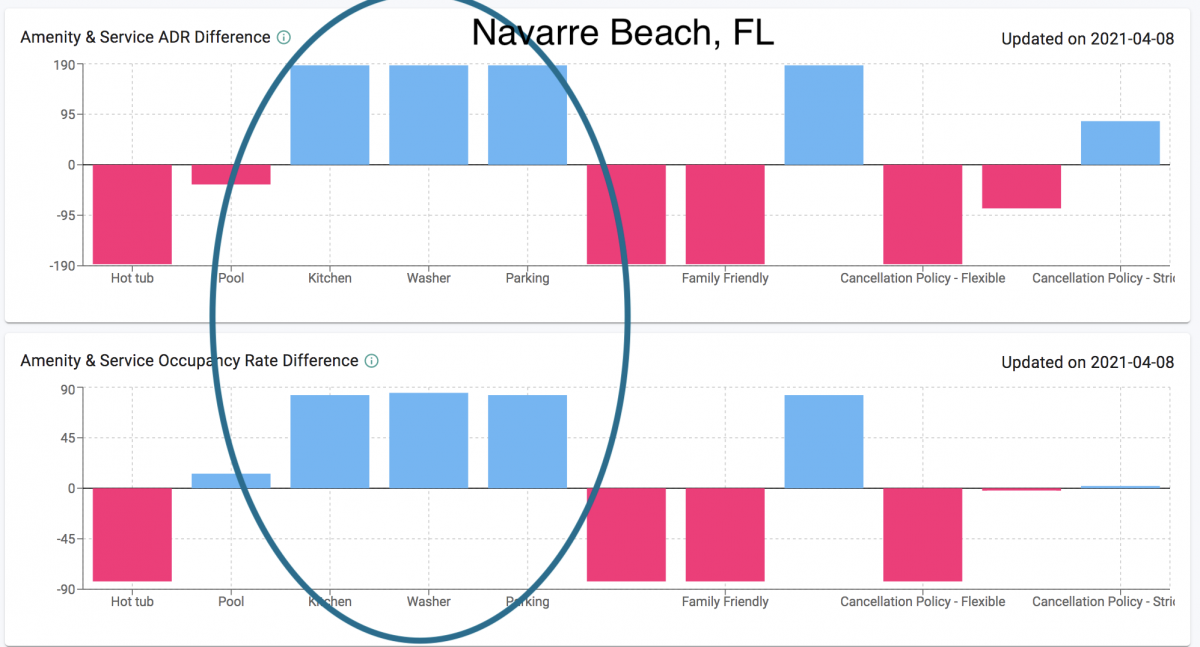
      Case 2. Navarre Beach, FL. It looks like it’s time to take care of the needs for mid-term stays. Airbnb guests are looking for a kitchen, washer, and parking rather than paying a premium for a hot tub or pool. They may prefer to just visit a beach nearby! You are highly likely to increase your RevPAR by equipping washer and kitchen (and parking if you can).

      Mid-term airbnb is on demand

      Should I make my Airbnb pet-friendly?

      Case 3. Sunriver OR (But this pattern was observed from many other destinations in the US) 


      Americans love traveling with their pets or at least they are willing to pay a huge premium for it, at least according to the data we see. We’ve seen a surge in both ADR and occupancy rates for pet-friendly listings in Sunriver, OR. For your reference, Sunriver is one of the top summer destinations in the US in 2021, 60% of Airbnb nights are already booked for this summer.  


      There will be much more wear and tear by allowing pets to be at your vacation home, but you may change your mind after knowing how much you can earn more by allowing pets at your home.

      Pet friendly Airbnb is booming

      Should I buy a washer for my Airbnb?

      Case 4. Brighton, UK.

      What’s happening in the UK? There’s a high demand for a mid-term stay in this traditional vacation destination called Brighton. This reflects the current travel restriction in the UK. People aren’t allowed to travel unless it’s necessary. Listings with hot tubs or pools won’t be booked, but listing with kitchen and washer are on-demand.

      Airbnb with Pool and occupancy rate

      Here’s a disclaimer. The data only shows the daily rate and the occupancy rate difference between listings with a specific amenity vs without. So, there could be a scenario where listings with pools have lower daily rates but it’s not because of the pool but because the listings with pools tend to be far away from a beach. 


      Nevertheless, this can help you understand the demand in your market. Many of our users are using this tool to find the supply-demand gap in the market. Then, they strategically market their listings to target the under-supplied group of guests. This typically results in a surge in their amount of bookings and an increase in the RevPAR.  

      Free Webinar

      Learn Airbtics in 7 Minutes

      Revenue and market analysis Tips and Best Practices!
      Airbnb Data
      Airbnb Data

      ARE YOU IN?

      Get Access to our weekly data-driven airbnb report!