 Airbtics | Airbnb Analytics
Precise Short-term Rental Analytics
Airbtics | Airbnb AnalyticsHome > Resources > Hosting Tips >
Airbnb Average Daily Rate

In this article, you will learn how much you can earn and charge for your Airbnb ADR (average daily rate). Continue reading!
[elementor-template id=”61228″]
It’s a fact that short-term rentals have more potential of generating revenue compared to long-term rentals because you can price your daily rate higher. One of the most important Airbnb key metrics is the average daily rate (ADR) – which is the main focus of discussion in this article.
We will feature some of the most frequently asked questions about Average Daily Rates (ADR), how to set an effective pricing strategy, and share a comparative market analysis for making the wisest investment decisions.
Do you want to know your potential daily rate for your property? Continue reading to learn more!
Average Daily Rate (ADR) refers to the average revenue that a single booked room can generate per day in one property. If you have ever tried to book an Airbnb property for a family getaway or a staycation, this is one of the most considered factors. ADR can be calculated by dividing the total bookings revenue by the total number of nights booked.
For instance, if you charge $120 per night and have a solid 70% occupancy rate, then you can expect to earn $30,660 before expenses and other taxes.
$150 x 0.70 x 365 = $30,660
In the USA, an Airbnb host can expect to earn an average daily rate of $236.95 based on Airbtics’ data. This may vary based on several factors such as the location, seasonality, and occupancy rate among others.
While Airbnb hosts’ daily rates vary according to their respective locations, there’s also a simpler and more accurate answer to this question! By using an Airbnb income calculator, you can easily determine your potential daily rate and even your annual revenue. Some of the several factors that affect an Airbnb host’s average daily rate includes:
For a more concrete example, let’s take a look at the short-term rental markets in Miami, Florida. Known as one of the popular destinations in Florida, here is a precise market overview of Miami according to Airbtics.
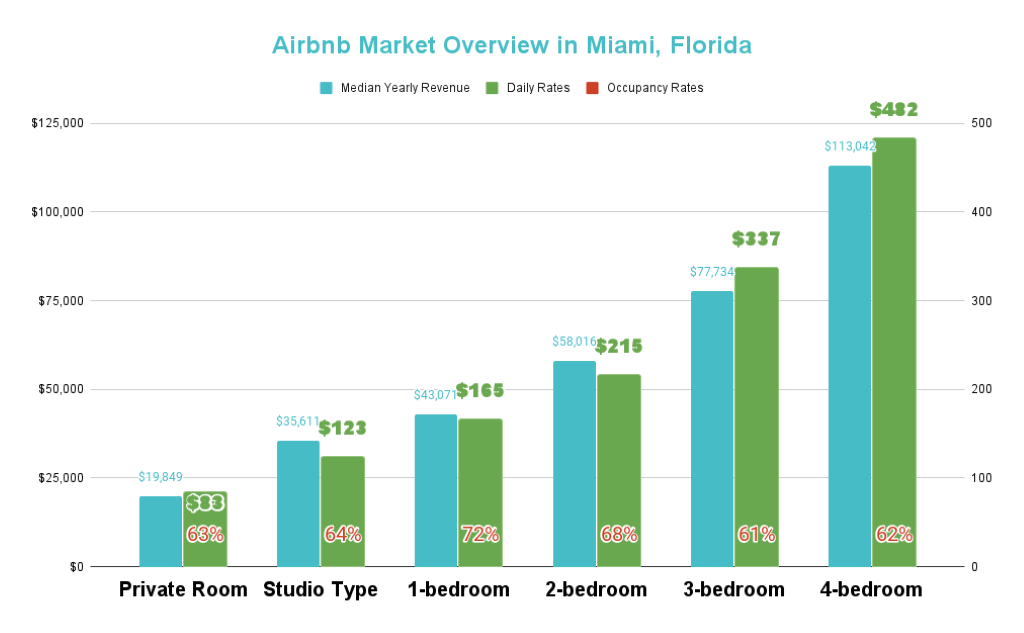
Your potential daily rate will depend on the property type and the number of bedrooms. However, the amenities you offer and your listing’s total number of reviews also contribute to your potential daily rate. It can also vary if you already have a superhost badge!
For instance, according to Airbtics, your potential average daily rate for running a 2-bedroom apartment/condo in London, UK is £2,196.
On the contrary, if you operate an entire house with 1 bedroom, you can expect an average daily rate of £2,203. Go ahead and discover areas with a high Airbnb occupancy rate in London.
Starting an Airbnb business can be as simple as renting out the extra space in your home. In order to identify your potential daily rate using an Airbnb income calculator from Airbtics, all you have to do is follow the 3 easy steps:
1. Input your Address
2. Use the filters: Bedrooms, Bathrooms, Property Type
3. Discover your potential daily rate!
In addition to this, if you want more precise data within your neighborhood, you can even create a custom market to target a specific area. The digital era makes it really as easy as 1,2,3!
Based on accurate data from Airbtics, here are the following cities with the highest Airbnb average daily rates:
Having an overview and studying the Airbnb statistics of your preferred city will help you decide whether it’s a wise investment decision or not. Using Airbtics’ Discovery tool, it’s a lot easier to discover the Airbnb markets with the highest average daily rates and occupancy rates!
You can set a pricing daily rate by studying and looking at your competitors’ prices within the area to make sure that you’re not pricing too high or too low. For instance, you can look at Airbnb’s website and enter your neighborhood to see how your competitors set their pricing. By comparing the amenities that you offer, accessibility to tourist destinations, and seasonality, you can set your pricing properly.
Setting your Airbnb pricing the right way will certainly help you to stay in the middle – not asking for too much, and definitely not receiving too little! Some of the factors to consider when setting your pricing are seasonality, demand and supply, and occupancy.
If you have lesser occupancy during the weekdays, it’s ideal to raise your prices to match the demand in your area. But if you have an open date between certain dates in a calendar, then you should consider lowering your Airbnb listing’s price.
No matter how beautiful your property is, if the price is a lot more expensive than nearby Airbnb listings, it’s more likely that guests will consider booking other properties instead.
Airbnb offers smart pricing, however, there are several reviews from hosts stating that the system keeps suggesting lowering their prices. This is why most of them use dynamic pricing tools for more accurate results!
⭐ Pro tip: Airbnb hosts who have mastered revenue management over the years commonly use the best Airbnb dynamic pricing tools available in the market in order to set pricing fairly.
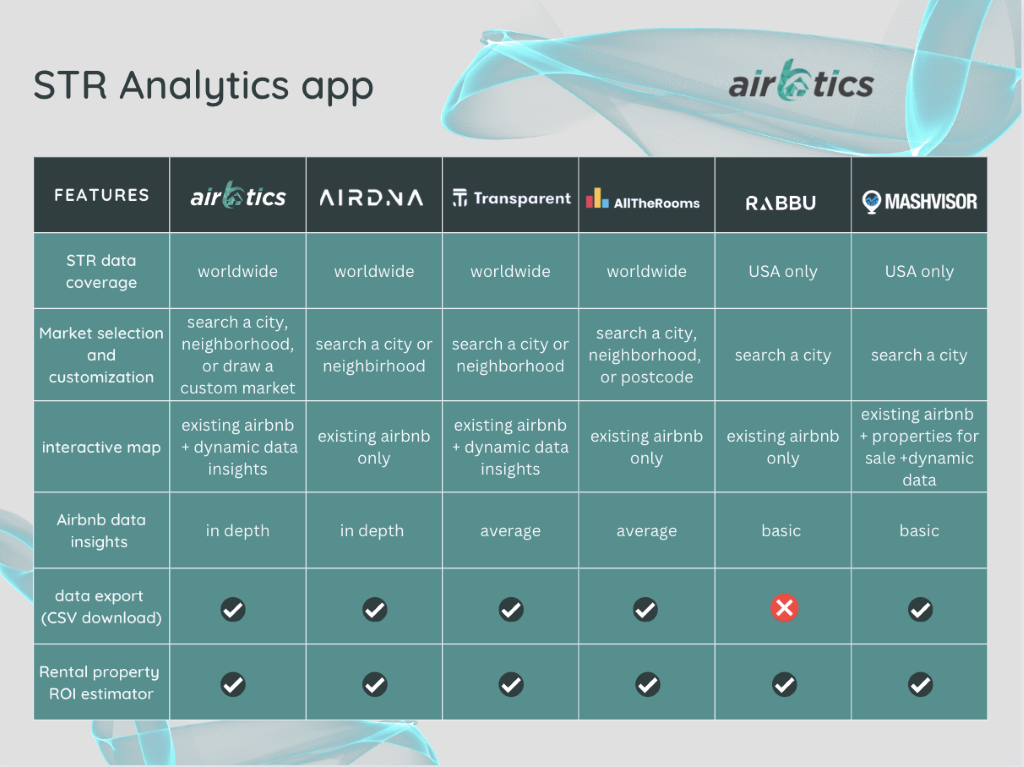
You can find a property’s Airbnb average daily rate by looking at some of the best short-term rental tools in the market. These short-term rental analytics tools like Airbtics are important to make more data-informed business decisions.
Not only will you be able to find Airbnb ADR data, but you will also get a complete picture of detailed revenue breakdown, individual booking, and pricing projections, and even discover emerging markets to attain more revenue.
If you are a beginner, it could be difficult to gauge which one is the most suitable software for your business needs. At the same time, you should also consider actual reviews of these STR tools in order to make the right decision.
For instance, AirDNA is commonly known in the industry for its features such as the Market Minder. Unfortunately, more and more people are looking for AirDNA alternatives because of the software’s inaccuracy.
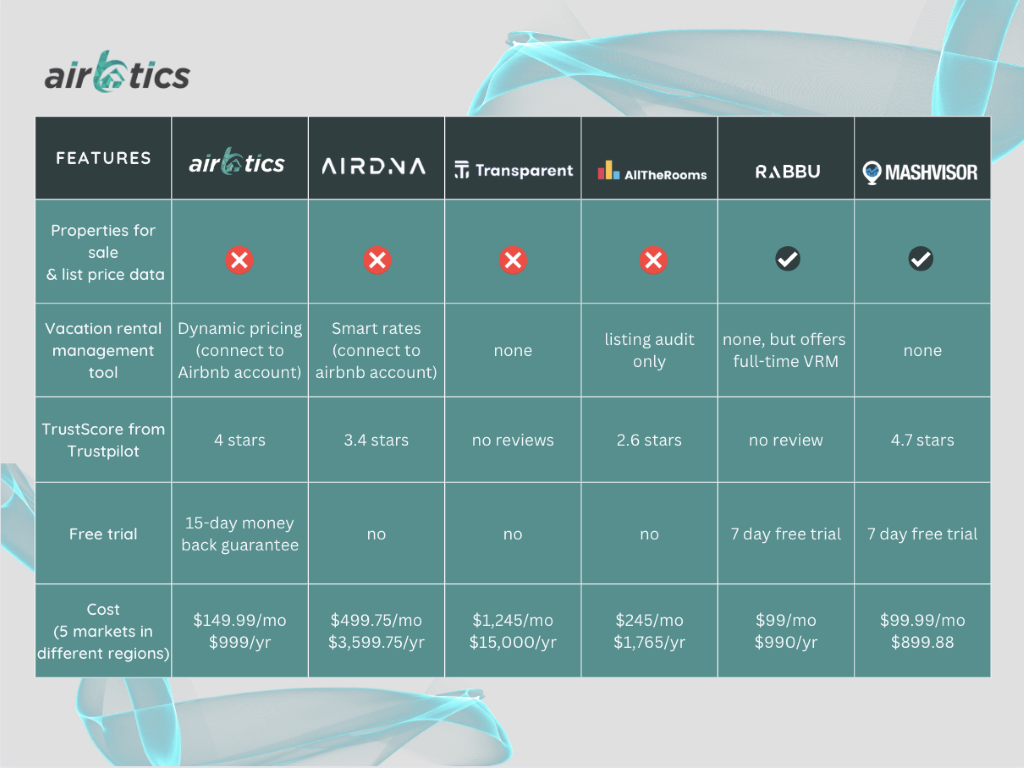
To help you make the best decision, here is a comparison table of the leading short-term rental providers available in the market:
Based on Airbnb’s recent report about the best Airbnb cities in the USA, millions of people are currently enjoying the digital nomad lifestyle! Using Airbtics’ accurate market analysis for the last 12 months, we were able to confirm the following Airbnb statistics:
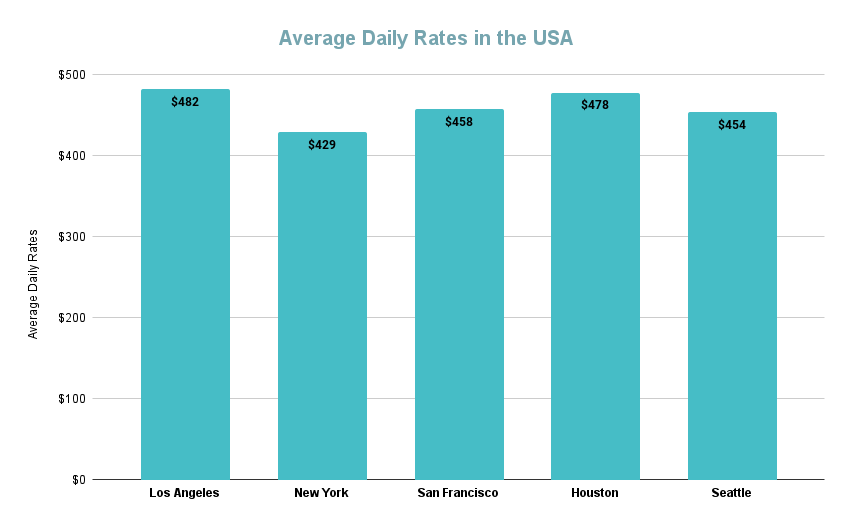
The following top-ranking Airbnb cities in America are based on the 5 most popular destinations in 2022 as per Airbnb. For each city, you can easily discover that the average daily rates vary according to property types and sizes. Let’s find out more about the ADR in key cities in the US:
Known for being the home of famous actors and artists, LA has surely exceeded the expectations of Airbnb hosts this year as it brought more guests. By looking at the best neighborhoods for Airbnb in LA, one can certainly learn how to generate a good cash flow in the city of Angels. Here are the average daily rates, occupancy rates, and median yearly revenue in Los Angeles, CA.
Based on Airbtics, the highest average daily rate in Los Angeles is $482 for a 4-bedroom property. On the other hand, the highest average occupancy rate in LA is 93% for studio-type properties.
It’s no surprise that Airbnb always has NYC on its list of top destinations year after year, after all – it’s the city that never sleeps! There are several best areas for Airbnb in NYC and the average daily rates vary accordingly.
According to Airbtics, the highest average daily rate in New York is $429 for a 4-bedroom property. On the other hand, the highest average occupancy rate in NY is 89% for both studio-type and 1-bedroom properties.
San Francisco is one of the best areas for Airbnb in California for plenty of reasons. Known as the Golden Gate City, this place can truly attract various tourists from across the globe for its wonders.
Airbtics states that the highest average daily rate in San Francisco is $458 for a 4-bedroom property. On the other hand, the highest average occupancy rate in San Francisco is 77% for 1-bedroom properties.
This unique city with lush reserve parks is known for its warm weather and low cost of living. No wonder why it’s one of the most visited Airbnb cities this year! Let’s take a look at the average daily rates in Houston:
Based on Airbtics, the highest average daily rate in Houston, Texas is $474 for a 5+bedroom property. On the other hand, the highest average occupancy rate in Houston is 55% for 1-bedroom properties.
Last but not least, the coffee capital! Seattle caters to various music scenes, the tech industry, and marine life attractions, and offers plenty of stunning parks. Check out the following Airbnb average daily rates in Seattle:
According to Airbtics, the highest average daily rate in Seattle, Washington is $454 for a 5+bedroom property. On the other hand, the highest average occupancy rate in Seattle is 88% for studio-type bedroom properties.
It’s no secret – Airbnb revealed that this year has made an enormous economic impact in Canada! According to Airbnb’s recent report of Canada, a typical host has earned approximately $10,300 in comparison to last year and $7,700 during the recent summer time. Talk about whopping cash overload!
As an essential process for data accuracy, we were able to confirm the following Airbnb statistics with Airbtics:
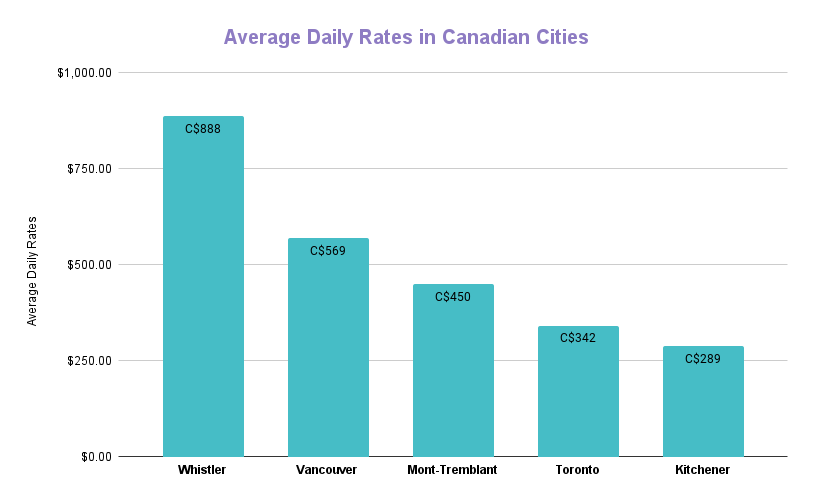
Canada’s top-ranking Airbnb cities featured below are based on the 5 most popular destinations in 2022 as per Airbnb. It was observed that the average daily rates in Canadian cities vary according to their respective property types and sizes:
It’s no doubt that this city is popular for its skiing and snowboarding activities, but there’s so much more to discover! Known as Canada’s most famous ski resort, Whistler attracts plenty of tourists and property investors from across the globe. One of the primary Airbnb rules in Whistler is to have a business license while considering the property’s zoning areas.
Based on Airbtics, the highest average daily rate in Whistler, BC is C$888 for a 4-bedroom property. On the other hand, the highest average occupancy rate in Whistler is 63% for both 1 and 2-bedroom properties.
2. Vancouver, British Columbia
Vancouver’s natural sceneries and rainy climate make it perfect for those who want to enjoy fun outdoor activities while earning a passive income through Airbnb! Check out the following Airbnb average daily rates in Vancouver according to their bedroom types:
According to Airbtics, the highest average daily rate in Vancouver is C$569 for a 4-bedroom property. On the other hand, the highest average occupancy rate in Vancouver is 93% for studio-type bedroom properties.
Situated within the heart of the Laurentian Mountains, Mont-Tremblant is definitely a favorite ski spot for the majority of tourists. Here’s an accurate overview of Airbnb statistics in Mont-Tremblant:
Airbtics’ data shows that the highest average daily rate in Mont-Tremblant is C$450 for a 4-bedroom property. On the other hand, the highest average occupancy rate in Mont-Tremblant is 60% for 1-bedroom properties.
If you want to invest in a Canadian city that’s known for its quality universities and world-renowned sports teams, then Toronto might be the best place to do so. Discover accurate results of Airbnb statistics in Toronto below:
Based on Airbtics, the highest average daily rate in Toronto, Ontario is $342 for a 4-bedroom property. On the other hand, the highest average occupancy rate in Toronto is 88% for studio-type bedroom properties.
Looking to invest in a vibrant city that’s only a couple of minutes’ drive from Toronto? Then Kitchener is the answer. While you can also experience fun skiing in this city, Kitchener also offers an array of parks and museums. Check out the Airbnb data in Kitchener:
Airbtics data shows that the highest average daily rate in Kitchener, Ontario is $289 for a 4-bedroom property. On the other hand, the highest average occupancy rate in Kitchener is 88% for both studio-type and 1-bedroom properties.
Australia is one of the many countries with increased inflation worldwide. Because of this, more and more hosts are determined to try the platform and earn extra money. Since the rental market statistics in Australia vary according to property types, location, and other factors, it’s important to conduct market research.
Based on a recent report from Airbnb news Australia, there are several host award winners for categories in 2022 to recognize their hard work! To name a few, this includes:
Fun fact: Did you know that new hosts in Australia earned over A$2.5 billion in 2021 alone? That’s an upward increase of 30% from 2019! Here is an accurate overview of Airbnb statistics in Australia as of January 2023 based on Airbtics:
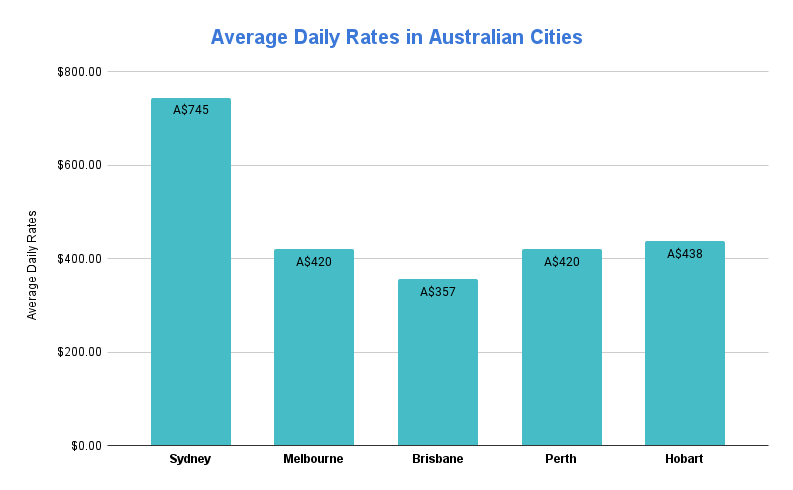
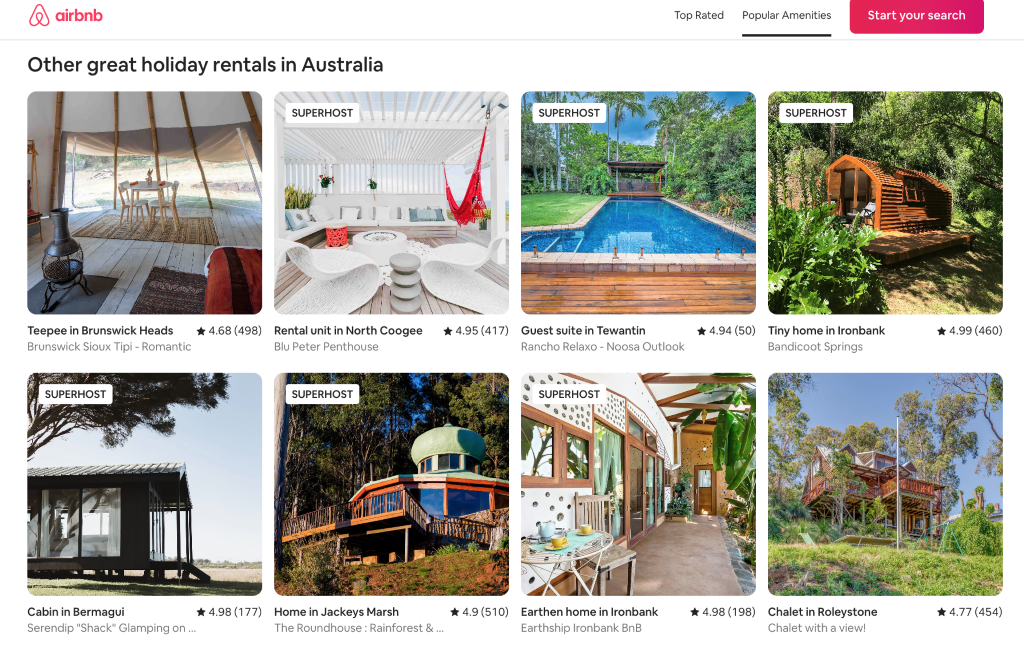
The following cities in Australia were filtered according to the top destinations in 2022 and travel trends in 2023 from Airbnb. Check out the best cities for Airbnb in Australia along with their average daily rates, occupancy rates, and yearly revenue:
Home to the iconic Opera House, Sydney is certainly a favorite tourist destination for all kinds of travelers. Luxury Travel Adviser recognizes Sydney as the most beautiful and exciting city in the world – perfect for operating an Airbnb business.
Based on Airbtics, the highest average daily rate in Sydney, NSW is A$745 for a 5+bedroom property. On the other hand, the highest average occupancy rate in Sydney is 88% for both studio-type and 5-bedroom properties.
Setting aside the fact that Melbourne is one of the most liveable cities on earth, this city offers tons of exciting experiences. This includes art centers, museums, exquisite nightlife, and architecture among others.
Based on Airbtics, the highest average daily rate in Melbourne, VIC is A$420 for a 5+bedroom property. On the other hand, the highest average occupancy rate in Melbourne is 82% for 1-bedroom properties.
Home to the world-renowned Australia Zoo, Brisbane is known for being a nature-oriented city with plenty of exciting outdoor activities. Because it offers year-round sunshine, it’s mostly preferred by various kinds of tourists and professionals alike!
Based on Airbtics, the highest average daily rate in Brisbane, QLD is A$357 for a 4-bedroom property. On the other hand, the highest average occupancy rate in Brisbane is 87% for both 1 and 3-bedroom properties.
If you’re looking to invest in a city that’s away from the cold winter and freezing temperature, Perth is definitely the place for you! Known as the sunniest capital in WA, Perth offers beaches with fine white sand and crystal clear water, botanical gardens, art galleries, and many more. Let’s take a look at the Airbnb data in Perth and evaluate the numbers:
Based on Airbtics, the highest average daily rate in Perth, WA is A$420 for a 5+bedroom property. On the other hand, the highest average occupancy rate in Perth is 88% for both 1 and 2-bedroom properties.
Popular for South Australia’s surf coastal areas, natural wildlife, and national parks, Hobart isn’t just another tourist destination. If you want to earn passive income through Airbnb while exploring museums, grabbing exquisite street eats, and exploring the ‘not-so-secret’ waterfalls – then Hobart is the place to go.
Based on Airbtics, the highest average daily rate in Hobart, TAS is A$888 for a 4-bedroom property. On the other hand, the highest average occupancy rate in Hobart is 92% for studio-type properties.
Operating holiday lets are primarily popular in the UK, particularly for Airbnb hosts who want to achieve financial freedom. In fact, Airbnb’s new data report shows that Airbnb Hosts based in the UK have profited over £1.5 billion in 2021, which is equivalent to 2 months’ worth of pay for the median UK household!
This simply means that you can successfully operate an Airbnb business with enough capital, market research, checking the real estate trends in the UK and of course – using the best STR software tool to achieve maximum profitability.
The following 5 UK cities featured in this article are based on Airbnb’s winter highlights data. For accuracy, we went ahead and used Airbtics’ accurate market analysis for the last 12 months and were able to confirm the following Airbnb statistics in the UK:
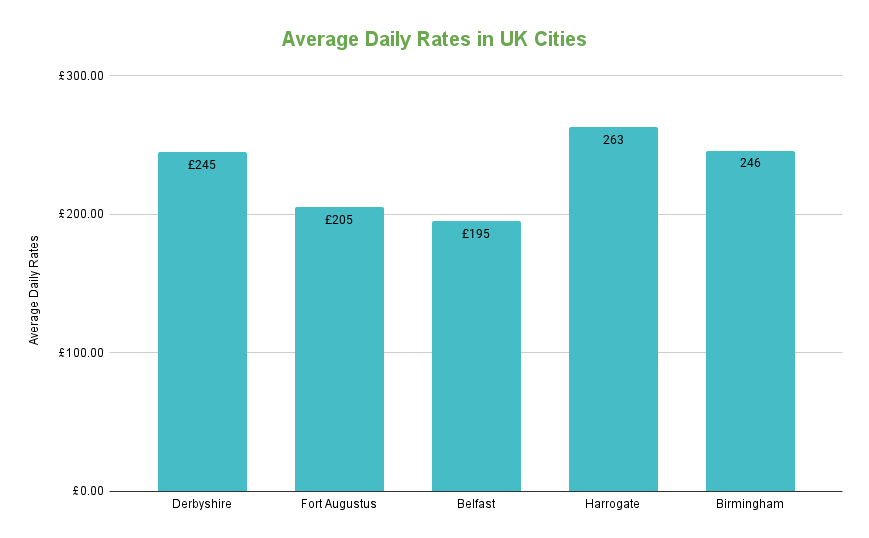
Derbyshire is admittedly one of the best places to visit in England. If you’re looking to invest in a place in the UK that’s close to nature, this city is highly recommended! Some of the most popular tourist destinations in Derbyshire are Peak District National Park, Buxton, Chatsworth House, and Gulliver’s Kingdom.
Based on Airbtics, the highest average daily rate in Derbyshire, England is £245 for a 4-bedroom property. On the other hand, the highest average occupancy rate in Derbyshire is 74% for 1-bedroom properties.
Fort Augustus is a well-known destination located on the southernmost tip of Loch Ness. It’s no surprise that Airbnb ranked this village in Scotland for its wonders! Its calm waters are certainly perfect for joggers, cyclists, and even meditation enthusiasts.
According to Airbtics, the highest average daily rate in Fort Augustus, Scotland is £205 for a 4-bedroom property. On the other hand, the highest average occupancy rate in Fort Augustus is 93% for studio-type properties.
As the capital of Northern Ireland, let’s not forget Belfast in the list of favorite tourist destinations in the UK. One of the most visited attractions in Belfast is the Interactive museum and homage called Titanic Belfast, in memory of the ocean liner’s tragedy. Another legendary event that most tourists like to visit in Belfast is the filming of Game of Thrones in 2010-2011!
Airbtics’ data reveals that the highest average daily rate in Belfast is £195 for a 4-bedroom property. On the other hand, the highest average occupancy rate in Belfast is 80% for studio-type properties.
If you’re looking to invest in places with gorgeous classic Victorian and Georgian architecture in the UK, then look no further! Harrogate boasts its vast greeneries and flowery parks which attract more than 3 million annual visitors, according to Visit Harrogate. Let’s take a look at the Airbnb data in Harrogate and evaluate the numbers:
Based on Airbtics, the highest average daily rate in Harrogate, England is £263 for a 4-bedroom property. On the other hand, the highest average occupancy rate in Harrogate is 80% for studio-type properties.
While this city in England has over 400 schools with plenty of tourist attractions at the same time, Birmingham is an ideal place to invest in. It’s commonly known to be the largest city in England after London and has the youngest population on the continent!
Based on Airbtics, the highest average daily rate in Birmingham is £246 for a 5-bedroom property. On the other hand, the highest average occupancy rate in Birmingham is 65% for 1-bedroom properties.
Airbnb became a boom in Spain over the past few years and the amount of hosts in the country is growing more and more as the cost of living continues going up. As a matter of fact, during the second trimester of 2022, the number of hosts on the Airbnb platform grew by more than 70%!
Based on Airbnb’s report, a typical host earns up to €4,100 per month, hence, it’s understandable that owning a listing here seems attractive. In addition to this, Spain ranked high in 2021 as one of the European countries with the highest percentage of long-stay reservations.
As an essential process for data accuracy, we were able to confirm the following Airbnb statistics with Airbtics:
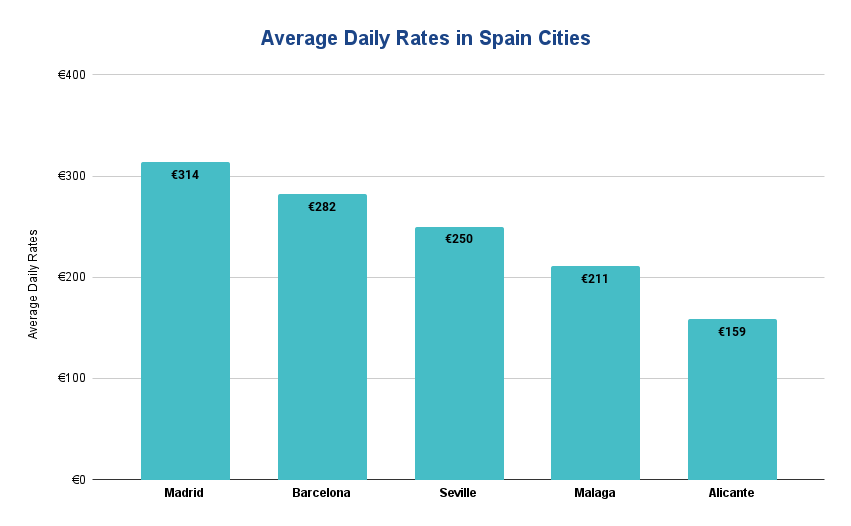
The annual revenue as well as average daily rates & occupancy rates in Spanish cities vary depending on the property type and its size. Find out more about this with the top-ranking Airbnb cities in Spain that we featured below:
During the last decade, Malaga became a renowned city in Costa del Sol, not only because of its picturesque beaches but also for its vibrant cultural life. This city has a charming environment capable of catching Spanish tourists as well as international ones, thanks to this, it took first place among the top trending travel spots for 2023!
Based on Airbtics, the highest average daily rate in Malaga is €211 for a 4-bedroom property. On the other hand, the highest average occupancy rate in Malaga is 85% for 2-bedroom properties.
Barcelona stands out as a top-level destination with unique leisure activities and an atmosphere capable of making anyone fall in love with this city. According to Airbnb’s report, this city became one of the favorite destinations for digital nomads. Not only that, because Investors will also find it interesting that Barcelona became a fully booked Airbnb city!
Based on Airbtics, the highest average daily rate in Barcelona is €282 for a 4-bedroom property. On the other hand, the highest average occupancy rate in Barcelona is 91% for studio-type properties.
Alicante offers great views of the Mediterranean sea to visitors and allows them to enjoy the ocean breeze while taking a stroll through its charming streets or eating its exquisite food. Being a tourist destination par excellence, this city is one of the trending summer destinations in Spain, and national travelers certainly love it!
Based on Airbtics, the highest average daily rate in Alicante is €159 for a 4-bedroom property. On the other hand, the highest average occupancy rate in Alicante is 81% for 1-bedroom properties.
Best known for its iconic museums, delicious gastronomy, and lively nightlife, Madrid stands out as a top tourist destination that welcomes with open arms to everyone. Thanks to this, the Spanish capital is a popular digital nomad city that occupies the top 15 in searches for international destinations according to Airbnb.
Based on Airbtics, the highest average daily rate in Madrid is €314 for a 4-bedroom property. On the other hand, the highest average occupancy rate in Madrid is 88% for 2-bedroom properties.
The eye-catching city of Sevilla is, undoubtedly, a place that leaves a special mark on the hearts and minds of visitors. There are a lot of things to see and do in this city that owns grandiose monuments such as the Alcázar and the Giralda. In fact, Seville welcomes around 2,5M tourists per year and is also a popular city among digital nomads.
Based on Airbtics, the highest average daily rate in Seville is €250 for a 4-bedroom property. On the other hand, the highest average occupancy rate in Seville is 76% for both studio-type and 1-bedroom properties.
Before diving in and spending your hard-earned money on property investment, it’s highly recommended to follow experts’ insights to avoid bankruptcy. Finding the best location that can generate the highest revenue according to your budget should not be based on wild guesses.
It’s proven in this article that no matter how many tourist arrivals or attractions a certain city is known for, the Airbnb revenue that a property can generate certainly differs accordingly. This is where a smart & reliable tool like Airbtics is truly needed! It’s bad enough to waste money and energy on a property that won’t meet your financial expectations, but what’s worse is not taking advantage of resources to avoid losses.
Here’s our final recommendation! Once you set your eyes on a particular city or neighborhood, it’s best to evaluate the accurate Airbnb performance of competitors in your preferred area and speak to real estate agents for planning. Then, run the numbers! Conducting market research using STR analytics tools like Airbtics will help you make a wise decision that you won’t regret – and even stand out among the rest.
[elementor-template id=”61999″]
[elementor-template id=”61999″]
[elementor-template id=”61124″]
[elementor-template id=”62160″]
[elementor-template id=”62200″]