fbpx
🎉 FREE WEBINAR - July 24th, 11am / 8pm CET - Learn Airbtics in 7 Minutes - Revenue and Market Analysis Tips and Best Practices!
Categories
Airbnb Occupancy All About Airbnb

Comparison of Airbnb Occupancy Rates in the cities of Australia: Sydney, Melbourne, Perth & more!

Are you looking for a place that is a continent, a country, and an island at the same time?  Then Australia is definitely the answer! Located below the equator of the earth, Australia is also known as the ‘land down under’. Since the pandemic hit the globe, the number of Airbnb listings has declined due to the lockdowns and border closures in Australia. Despite the fact that there is a decrease in the overall total number of listings in this country, you’ll be surprised to know that NOT all Airbnb hosts were affected. Because of the consistent demand for rural getaways in Australia, the Airbnb property occupancy rates (particularly in Sydney & Melbourne) has increased from January to April 2021, according to Business Insider Australia.

Relatively, we managed to notice the comparison of the 2021 and 2022 Tourism statistics in Australia. Therefore, if you are wondering…   Is Airbnb profitable or a good investment in this country? If so, which city or neighborhood should I keep my eye on based on Airbnb statistics in Australia? Continue reading & find out what we discovered!

Occupancy Percentage & Annual Monthly Revenue in Australia
Frequently Asked Questions

Yes, Airbnb is legal in Australia - with strict compliance to local & state laws. If you are planning to start your Airbnb business under a lease agreement, then the first thing you have to do is to let have your landlord's consent.

Contrary to this, if you are a property owner, it is necessary to follow the steps for registration and pay the necessary fees.

Typically, the months of September to December are the peak seasons in Australia with an average of 59% occupancy rate.

According to Airbtics' Data, the average daily rate in Australia is A$398 for apartment (condo) & A$106 for studio-type rooms.

As of April 2022, both the cities of Darwin & Perth have the highest occupancy rate of 53%.

Based on Airbtics data, it's clear that Airbnb is profitable in Australia. To support this claim, The Australian Bureau of Statistics shows that both domestic and international tourism has rapidly increased this 2022. 

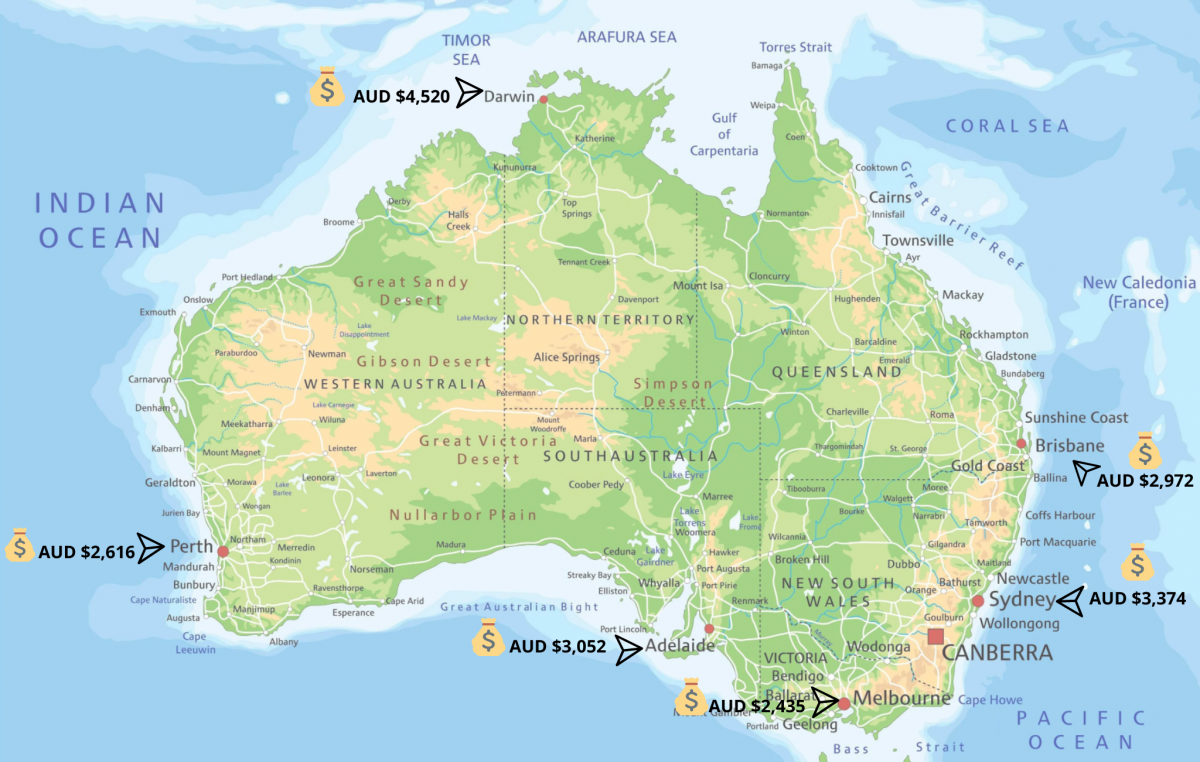
Based on our in-depth research, if you are looking forward to maximizing your monthly revenue in Australia, Darwin is ranked 1st on our list. Aside from its high occupancy rate of 53%, you can also earn an average of A$4,520 per month!

According to Airbnb, here are some of the popular amenities that you might want to consider having in your business:

- Fully-equipped kitchen

- Reliable Wi-Fi

- An outdoor pool

- Free parking on premises

- Air conditioning

If you're looking for a more detailed description of Airbnb amenities, check out the top amenities that all Airbnb hosts must have this 2022!

According to Book Kept, any income derived from rent will automatically be assessable income - therefore, yes it's taxable!

Learn more about tax deductions & accounting tips for Airbnb hosts here.

According to our Airbtics calculator, Perth & Darwin have the highest occupancy rates in Australia. Therefore, an Airbnb host can make an annual revenue of the following:

Perth: A$35,808

Darwin: A$57,720

Yes, an Airbnb host will need the approval of the local council and a licence to be registered as a Bed & Breakfast accommodation before formally operating. 

Here is a summary of the laws applicable to short-term lettings:

  1. Town Planning Law - explains the difference between renting out rooms in a home, flat, or whole apartment.
  2. Insurance Law - coverage for landlord's policies including host protection insurance & host guarantee.
  3. Taxation Law - these include capital gains tax, income tax, and Goods & Services Tax (GST). 
  4. Strata Law - prohibits any restrictions on an owner's right to rent out their strata apartment.
  5. Tenancy Law - prohibits tenants from sub-leasing the property without the landlord's consent.

Learn more about laws concerning short-term lettings in Australia.

Most of the major business taxes such as income tax from your revenue are collected by the Australian Government through ATO. Your own tax obligations may vary under certain circumstances, you can directly consult ATO or a tax professional.

Check out the tax considerations on short-term lettings in Australia.

australia occupancy rate

Here is a general overview of Australia’s occupancy percentage, median daily rate & average monthly revenue as of April 2022.

In order to come up with accurate data of the respective cities in Australia, we utilized the Airbtics data analytics tool and filtered the listings into 1 bed / 1 bath Apartment (Condo). Check out the following rates in the biggest cities in Australia:

Sydney:

Occupancy Rate: 39%

Median Daily Rate: A$267

Average Monthly Revenue: A$3,374

Melbourne:

Occupancy Rate: 38%

Median Daily Rate: A$199

Average Monthly Revenue: A$2,435

Brisbane:

Occupancy Rate: 48%

Median Daily Rate: A$201

Average Monthly Revenue: A$2,972

Adelaide:

Occupancy Rate: 47%

Median Daily Rate: A$195

Average Monthly Revenue: A$3,052

Perth:

Occupancy Rate: 53%

Median Daily Rate: A$143

Average Monthly Revenue: A$2,616

Darwin:

Occupancy Rate: 53%

Median Daily Rate: A$258

Average Monthly Revenue: A$4,520

how much can you make on airbnb
Sydney australia airbnb occupancy rates

Here are some of the most recommended neighborhoods in Sydney that you might want to consider:

  • For sightseeing: Circular Quay & The Rocks
  • For nightlife: Kingscross
  • For families & beachfront areas: Bondi & Manly
  • For first-time visitors: City Centre
  • For shopping: Darling Harbour

While this city has a lot of exciting activities to offer in general, you may also want to check out the rest of the best areas to stay in Sydney! Among the 6 major cities, Sydney has the highest median daily rate of A$267.

Sydney

The Emerald City is definitely included in the bucket list of must-see places for most travelers! Located on the southeastern coast of Australia, Sydney is the capital of New South Wales and is one of the largest cities in Australia. According to Sydney Tourism Statistics, the majority of travelers are for visiting for holiday wherein they spend an average of $225 per night.

Sydney is best known for iconic landmarks such as the harbourfront Sydney Opera House, Harbour Bridge, Bondi Beach & Royal Botanic Garden. Because travelers have so many fun things to do in Sydney, it is the most visited destination in the country with about 32 million visitors per year!

Melbourne

Located at the head of Port Phillip Bay, the beautiful city of Melbourne is the capital state of Victoria. Known as one of the most livable cities on earth, this city has multiple public transport options and a relatively low crime rate.

One of the fun facts about Melbourne is that it’s the first city outside of Europe & North America to host the Olympic games!

According to Victoria’s Visitor Economy, a whopping amount of A$57.8 million has been collected from Melbourne alone in 2021. It was also shown in the statistics how the visitors in Melbourne tremendously contribute to the tourism expenditure of Australia. 

Melbourne australia

Check out the best areas that you might want to invest in according to your preference:

  • For sightseeing: City Center
  • For nightlife: St Kilda
  • For families, shopping centre & beachfront areas: Docklands & St Kilda
  • For first-time visitors: City Centre
  • For food & restaurants: Southbank
  • For watching sports (tennis, golf, horse and car racing): East Melbourne

The majority of tourists in this vibrant city often stay longer than expected because of its top attractions & an unmistakably European feel. 

Brisbane australia average daily rates airbnb

Let’s discuss the compelling neighborhoods of Brisbane:

  • For sightseeing: Brisbane City Centre
  • For surfing: Burleigh Heads
  • For families: South Bank & Broadbeach
  • For outdoor activities: Kangaroo Point & Surfer’s Paradise

Finally, while it’s important to know that there are fun destinations to explore in Brisbane, another takeaway is that public transportations are accessible in this city. 

Brisbane

Along the southern slopes of the Taylor Range, Brisbane is located in the southeast corner of Queensland.

As it offers an interesting number of suburbs and Queenslander architecture, it’s also a fact that it outperformed both Sydney & Melbourne as the 39th best city in the world to raise a family. Because of Brisbane’s assurance of safety, affordability, and air quality among the others, it iconically presents that it’s definitely worth the investment!

Based on Brisbane Tourism Statistics, international visitors have contributed over $2.2 billion while domestic visitors have spent $4 billion in 2020 alone. Undoubtedly, the must-see destinations in Brisbane have attracted more tourists over the years!

Adelaide

This particular city in Australia is known for being incredibly festive – from premium wine regions to events & festivals, and various kinds of thriving food culture!

Adelaide is popular for its gorgeous heritage architecture and diverse communities. According to South Australian Tourism Commission, Adelaide has a visitor expenditure of $170 million annually and it is expected to rapidly increase over the years.

It’s also probably worth mentioning that they have low unemployment rates & a healthy economy! Since there are plenty of opportunities for internships & employment, a handful of foreign exchange students and entrepreneurs are more likely to visit and have reasons to live in Adelaide.

Darwin australia northern territory

Let’s dive into the following neighborhoods and contemplate if it’s the right match for your Airbnb business!

  • For sightseeing: Circular Quay & The Rocks
  • For nightlife: West End
  • For families: Glenelg
  • For outdoor adventure: Adelaide Hills

If you are planning to put up a business within the heart of this city, then your guests will certainly enjoy the top destinations in Adelaide!

Perth australia

Here is a list of top neighborhoods that you might consider investing into!

  • For sightseeing: City Center
  • For outdoor activities: Scarborough & East Perth
  • For food & restaurants: Fremantle
  • For families: Scarborough
  • For boat trips: Elizabeth Quay

After a thorough investigation, we also found out that Perth has the same occupancy percentage of 53% as Darwin!

Perth

A city and capital of Western Australia, Perth offers an appealing combination of old & new. In comparison to other regions in WA, Tourism Western Australia ranked Perth with the highest total number of visitors ($2.9 million) in 2021. 

The majority of tourists in this city commonly prefer to stay in the city center because of its accessibility to almost everything! Perth is proud to present its world-class wineries, botanic gardens, and wildlife sanctuaries.

In addition to this, the city has a lot to offer to tourists who are daredevils who are looking for adventurous things to do in Perth!

Darwin

If you are looking for a more isolated yet close-to-nature kind of city, Darwin is the best place to go! Located centrally on the northern coast of Australia, Darwin is the capital of the Northern Territory and is famous for humid weather.

Tourists can discover great things to do in Darwin such as waterside attractions, visit a jumping crocodile cruise, try multicultural food and so much more!

According to NT Tourism Research Australia, the room occupancy rate in Darwin is at 49% as of March 2021.

Adelaide australia

Here is a list of top neighborhoods that you might consider investing into!

  • For sightseeing: The Gardens & Mindil Beach
  • For outdoor activities: Scarborough & East Perth
  • For food & restaurants / business travelers: Central Business District
  • For families: Casuarina, Leanyer & Malak

Based on our in-depth research, this city is actually our winner when it comes to average monthly revenue. Although it has the same occupancy percentage as Perth, we also discovered that you can make up to A$57,720 annually for a 1 bed / 1 bath!

MORE AIRBNB OCCUPANCY RATES IN AUSTRALIAN CITIES?

We conducted in-depth research & utilized our Airbnb occupancy rate calculator to feature the occupancy rates of major cities! 

Australian cities with highest occupancy rates

In summary, Australia has a number of promising cities with an excellent amount of tourists visiting the country annually and this is something that an Airbnb host like you should take advantage of. While each city’s tourist spots & cultural landmarks may sound inviting in general, it’s important to have accurate data for your Airbnb business to make sure that you’ll continuously strive in the industry.

Now that you have an insight into occupancy rates in the major Australian cities, it’s certainly essential to speed up your game by having an access to a reliable data analytics tool and make sure to cover all – not just 1 bed / 1 bath for Apartment (Condo) types.

With the help of our all-in-one analytics service, you can vastly enhance your monthly revenue, create a comparison for each neighborhood, add the appropriate amenities and so many more exciting features. Try Airbtics now and stand out among your competitors!

Categories
Airbnb Occupancy All About Airbnb

Airbnb Occupancy Rates & Best Neighborhoods in Los Angeles, California

What are the best neighborhoods in Los Angeles & their Airbnb occupancy rates this 2022? Find out more accurate information in this article!

Los angeles occupancy rate california

What are the best neighborhoods in Los Angeles & their Airbnb occupancy rates this 2022? Find out more accurate information in this article!

Let’s talk about one of the most influential cities in the world — the City of Angels!

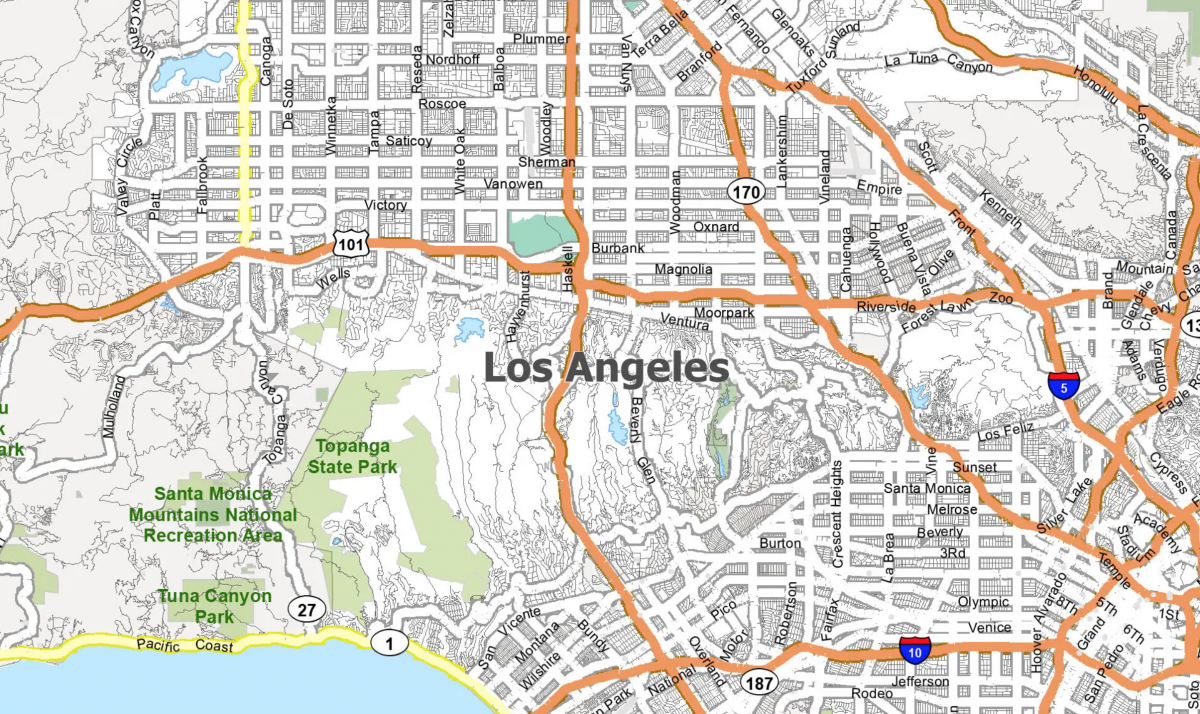
It is a fact that Los Angeles is home to countless artists, actors, athletes, entrepreneurs in various industries, and famous personalities who are vastly recognized across the globe. Located in Southern California, LA is the second-most populous city in the USA. 

According to World Atlas, LA is one of the top tourist destinations around the world which has about 4.6 million visitors annually! Undoubtedly, this city is a favorite tourist destination because it has a little bit of everything: the famous Hollywood sign, a beautiful view of the ocean, fantastic variations of gastronomy, art museums, theme parks, and so many more!

While other homeowners are considering rental arbitrage in California, knowing the occupancy rates in your preferred location is important. If you’re targeting this particular city in California to invest in an Airbnb but don’t know where to start, this article might just be the perfect guide for you.

Los Angeles City Occupancy Rates & Average Monthly Revenue

WANT TO SEE MORE?

View the free Airbnb occupancy rates data in all the cities of the world!

Los angeles california airbnb occupancy rate

Frequently Asked Questions

Yes! According to the Short-term Rental Ordinance of Los Angeles, certain conditions and requirements have to be strictly followed by STR owners.

For general questions about STR Ordinance, feel free to send a message to LA County's official email address: [email protected]

All property owners engaged in short-term rentals are required to register, collect, and remit the Transient Occupancy Tax (TOT) of 14% to the City of Los Angeles.

Bonus: There are certain exemptions - check out the qualifications for exemptions indicated in this article!

Typically, the months of August to September are the peak seasons in LA with an average of 55% occupancy rate.

As of April 2022, Santa Barbara has the highest occupancy rate of 62% with an average monthly revenue of  $7,256.

According to Airbtics' data, Airbnb hosts in Los Angeles can earn up to $41,436 per year.

Based on our thorough research using Airbtics analytics tool, it shows that Airbnb in LA is certainly profitable! As long as you can find the most ideal location for your Airbnb business and base your strategies on a reliable data analytics tool - you should be on to a good start!

According to Airbtics' data, the highest daily rate among the mentioned neighborhoods in this article is in Malibu - with a median daily rate of $720 and an average monthly revenue of $9,987!

As of April 2022, there is currently a total number of 13,553 listings in Los Angeles, California.

It's a fact that amenities are one of the winning factors for most guests, which is why we also created a separate article discussing why it's important to invest in the Top Airbnb Amenities!

According to a recent article indicating the best Airbnbs in LA, here are some of the must-have amenities that you might want to consider adding:

- Excellent & Reliable Wi-Fi

- Closet & drawer space 

- Full kitchen (+ coffee maker!)

- Bathroom with personal items & toiletries

Bonus: 24% of the overall listings in LA have a pool, too!

I'll save you some time and leave it here -- yes, it's certainly legal! Check out this article and learn more about the definition and methods of Rental Arbitrage in Los Angeles.

Based on the highest monthly revenue of $9,987, Malibu is the most recommended neighborhood in LA. 

The Rent Stabilization Ordinance in LA is a local law that took effect on April 1, 2020. This ordinance refers to limiting rent increases above the allowable limit within a 12-month period. 

For more clarifications on this ordinance, check out the official RSO released by the County of Los Angeles.

In California, a short-term rental refers to an accessory use of a residential property for the purpose of providing temporary lodging for compensation for periods of 30 consecutive days or less.

Learn more about the regulations and requirements of short-term rentals in Los Angeles, CA.

To begin with, let’s try to look at the bigger picture by targeting the Airbnb data for the entire city of Los Angeles. For every case study, we use Airbtics’ data analytics tool to come up with accurate numbers.

The data shown above is based on a 1-bedroom Apartment (Condo) in Los Angeles. It has an average occupancy rate of 46% with a median daily rate of $234 and average monthly revenue of $3,359. If this sounds promising to you, let’s check the top 10 neighborhoods in the city and their respective data!

los angeles occupancy rates

As seen on the column chart above, these are the following occupancy rates & average monthly revenue of the 10 best neighborhoods in Los Angeles. To boost the excitement, we decided to go a little more in detail and added the median daily rates for each neighborhood!

Santa Monica:

  • Occupancy Rate: 53%
  • Median Daily Rate: $218
  • Average Monthly Revenue: $4,154

Malibu:

  • Occupancy Rate: 44%
  • Median Daily Rate: $720
  • Average Monthly Revenue: $9,987

Long Beach:

  • Occupancy Rate: 58%
  • Median Daily Rate: $196
  • Average Monthly Revenue: $3,603

Irvine:

  • Occupancy Rate: 46%
  • Median Daily Rate: $197
  • Average Monthly Revenue: $3,093

Huntington Beach:

  • Occupancy Rate: 56%
  • Median Daily Rate: $207
  • Average Monthly Revenue: $4,241

Big Bear Lake:

  • Occupancy Rate: 35%
  • Median Daily Rate: $230
  • Average Monthly Revenue: $2,538

Hermosa Beach:

  • Occupancy Rate: 42%
  • Median Daily Rate: $315
  • Average Monthly Revenue: $4,439

Brentwood:

  • Occupancy Rate: 41%
  • Median Daily Rate: $191
  • Average Monthly Revenue: $3,126

Santa Barbara:

  • Occupancy Rate: 62%
  • Median Daily Rate: $326
  • Average Monthly Revenue: $7,256

Joshua Tree:

  • Occupancy Rate: 47%
  • Median Daily Rate: $95
  • Average Monthly Revenue: $1,695

Top 10 Best Neighborhoods in Los Angeles

santa monica california occupancy rates
Santa Monica

A beautiful beachfront city located in Western Los Angeles County, Santa Monica is famous for being a walkable & bike-friendly town. According to the City of Santa Monica Tourism, this particular city attracts over 8 million visitors annually!

Some of the favorite scenic spots are the Santa Monica Pier, the Museum of Flying, and the Hippodrome. There are also carnival attractions and talented street performers & tourists can enjoy a handful of exciting activities when they visit Santa Monica. Relatively, this is where business-minded people like you should pitch in strategic ideas to maximize your Airbnb’s profit.

Malibu

“Here I am, next to you, the sky is so blue – in Malibu”, yes, Miley Cyrus was accurately describing just how breathtaking this place is. Located along the Pacific Coast Highway, this city is famous for its landmarks such as Malibu Lagoon State Beach, Point Dume, Malibu Pier, & Zumba Beach.

Although this city is known as the home for Hollywood stars and top athletes, it’s not exclusive for them alone. Numerous tourists are revisiting Malibu annually to explore its wonders and dive into appealing activities such as surfing & wine tasting!

If you were able to check our FAQs section, then you’ll definitely know that this city was rated with the highest median daily rate & monthly revenue amongst all the other neighborhoods in LA. 

Malibu california occupancy rates
Joshua tree california airbnb rates
Joshua Tree

Where two deserts meet — Joshua Tree is located in Joshua Woodlands & Antelope Valley in northeastern LA County. 

Full of wildlife history, this particular neighborhood has nine developed campgrounds within the park. Because the area itself offers a unique LA experience with outdoor activities, they have a record of 2.8 million annual visitors according to National Geographic. Some of the must-see tourist attractions in this area are the Cholla Cactus Garden, Skull Rock, Hidden Valley Nature Trail & Cottonwood Spring Oasis.

During our research, we discovered that the Joshua Tree has the lowest average monthly revenue due to the specific listing that we filtered (1 bed, 1 bath) using our data analytics tool. However, its overall occupancy rate & monthly revenue was surprisingly high in studio-type rooms.

Irvine

Behold, the economic center of Southern California in Orange County — Irvine! With the overwhelming number of tourists visiting this place, the Irvine travel industry has contributed over $49 million in local and state taxes alone in 2019. 

Based on Greater Irvine Chamber, tourists spend the highest amount on accommodations in Irvine.

In this neighborhood, there are also numerous attractions including Irvine Spectrum Center, Tanaka Farms, Disneyland Resort, San Joaquin Wildlife sanctuary & other exciting places that most tourists would definitely love to see.

irvine california airbnb daily rates
brentwood california average daily rate airbnb
Brentwood

If you are particularly targeting travelers with families as your guests, Brentwood is the most recommended neighborhood to invest in. Located at the base of the Santa Monica Mountains, Brentwood has plenty of outdoor recreation opportunities with backyards that offer the best views of LA.

Some of the favorite tourist sights are Old MacDonald’s Farm, Brentwood Cathedral, The Farmers Daughter Produce & Hopefield Animal sanctuary.

In addition, this neighborhood was also marked with a lower crime rate & is safer than 94% of LA neighborhoods.

Hermosa Beach

From the Spanish word itself ‘hermosa’, this ocean frontage is truly beautiful. Located just six miles south of LA International Airport, Hermosa Beach hosts events such as volleyball tournaments and surf festivals which attract visitors annually.

Some of the famous local landmarks are the Vetter Windmill, Roundhouse Aquarium, Les Bacon Ford & Redondo Beach Pier.

According to South Bay Business, the median property value in this neighborhood is rapidly increasing annually and the households have a median annual income of $136,702.

Hermosa beach california airbnb
big bear lake occupancy rate california
Big Bear Lake

The jewel of the San Bernardino National Forest, Big Bear Lake, is located within the heart of Southern California.

Yearly, there is an average number of 3 million visitors in this neighborhood. Remarkable landmarks in this area include Big Bear Alpine Zoo, Butler Peak, Castle Rock Trail, Boulder Bay Park, and Pine Knot Village.

Summer activities such as water sports, mountain climbing, fishing, and other outdoor exercises in Big Bear Lake will make this trip worthy to travel to!

Long Beach

Considered as the 7th largest city in California, visitors of Long Beach can actually generate an estimated amount of $300 million in the overall economic benefit to the city! Tourism is a very important industry – especially in this neighborhood. 

Popular for its waterfront attractions, it is also known for hosting the Grand Prix of Long Beach (IndyCar race) and pride festival & parade. Because of numerous fun events held in this area, business travelers in various industries are also consistently traveling to Long Beach annually. 

Some of the best sights & historical landmarks in Long Beach are El Dorado Nature Center, The Pike Ferris Wheel, Belmont Shore & Downtown Long Beach.

long beach california airbnb occupancy rates
Huntington beach california average occupancy rates
Huntington Beach

Located in Southern California between LA & San Diego, Huntington Beach is also proud to present its breathtaking ocean views and is accessible to 3 airports.

Similarly, this neighborhood attracts a handful of tourists yearly because of surfing competitions, particularly the U.S. Open of Surfing. The Huntington Beach Pier, Old World Village, Hamboards, and Bolsa Chica Ecological Reserve are among the many tourist attractions in this area.

While there are great activities to do in Huntington Beach, it’s also important to take note that its average occupancy rate is at 56% in comparison to other beach areas in Los Angeles.

Santa Barbara

Last but definitely not the least – one of the most glamorous towns in California, Santa Barbara is a year-round tourist destination. While it’s important to know where to go in Santa Barbara, let’s not forget that this is our winner with the highest occupancy rate of 62%!

Surrounded by numerous fascinating landmarks such as Casa del Herrero, Old Mission Santa Barbara, The Courthouse, and Chumash Painted Cave State Historic Park – this neighborhood is definitely worth investing in.

According to Santa Barbara South Coast, this particular neighborhood has about 28,000 visitors daily as it welcomes an average of 7.2 million tourists yearly.

los angeles california best neighborhoods airbnb

Based on our in-depth research in Los Angeles, all of the top 10 neighborhoods are offering various sets of promising views & attractions to help you thrive in your Airbnb business. However, with their respective occupancy rates for 1 bed / 1 bath apartment (condo) types, it is difficult to gauge if the rates are stable according to your preferred listing. To make this less difficult for hosts like you, having an access to an excellent data analytics tool is essential to support your business.

If you will base your assumptions on articles portraying poorly estimated costs or a wild guess, then you will certainly find inaccurate results. Since you already have a broad perspective of occupancy rates for apartment types this 2022, don’t settle!

With the help of our all-in-one analytics service, you can vastly enhance your monthly revenue, create a comparison for each neighborhood, add the appropriate amenities and so many more exciting features. Try Airbtics now and stand out among your competitors!

Explore The Most Profitable Airbnb Locations Near Los Angeles

Unlock Worldwide
Short-Term Rental Data
Find unsaturated neighborhoods with the highest occupancy history.

airbnb occupancy rates in los angeles

airbnb occupancy rates in los angeles

airbnb occupancy rates in los angeles

Annual Airbnb Revenue in Leicestershire, UK

Annual Airbnb Revenue in Leicestershire, UK How Much Can I Make With Airbnb In Leicestershire , UK? Is it profitable to do Airbnb in Leicestershire, …

Read More →
airbnb property for sale Bristol City Centre
Investing in Property for Sale: How to Buy A Profitable Property for Airbnb in Bristol City Centre

airbnb property for sale Bristol City Centre Bristol City is one of the most fascinating cities in Britain as it offers more than museums and …

Read More →
Annual Airbnb Revenue in Springdale arkansas, USA

Springdale, Arkansas| Airbnb Market Data & Overview | USA Springdale, Arkansas Airbnb Market Data & Overview USA Is it profitable to do Airbnb in Springdale, …

Read More →
Annual Airbnb Revenue in Moray, UK

Moray| Airbnb Market Data & Overview | UK Moray Airbnb Market Data & Overview UK Is it profitable to do Airbnb in Moray, UK? What …

Read More →
Airbnb Rules in Sydney

Looking to invest in Sydney, Australia? Learn more about Airbnb rules and restrictions in Sydney for short-term rental accommodations. Home > Resources > Airbnb Rules …

Read More →
Annual Airbnb Revenue in Rancho palos verdes california, USA

Rancho Palos Verdes, California| Airbnb Market Data & Overview | USA Rancho Palos Verdes, California Airbnb Market Data & Overview USA Is it profitable to …

Read More →

Categories
Airbnb Investment Blog posts

Airbnb Calculator | Host Profit Estimator

Airbnb Calculator

Instantly See Your Airbnb's Estimated Revenue

The leading Airbnb profit calculator in the short-term rental industry. Discover your Airbnb earnings potential.

Trusted by 50,000+ Short-Term Rental Businesses
Logo 1
Logo 2
Logo 3
Logo 4
Logo 5
Logo 6
Logo 7
Logo 8
Logo 9
Logo 10
Logo 11
Logo 12
Logo 13
Logo 14
Logo 15
Logo 1
Logo 2
Logo 3
Logo 4
Logo 5
Logo 6
Logo 7
Logo 8

Check out our Free Airbnb Calculator

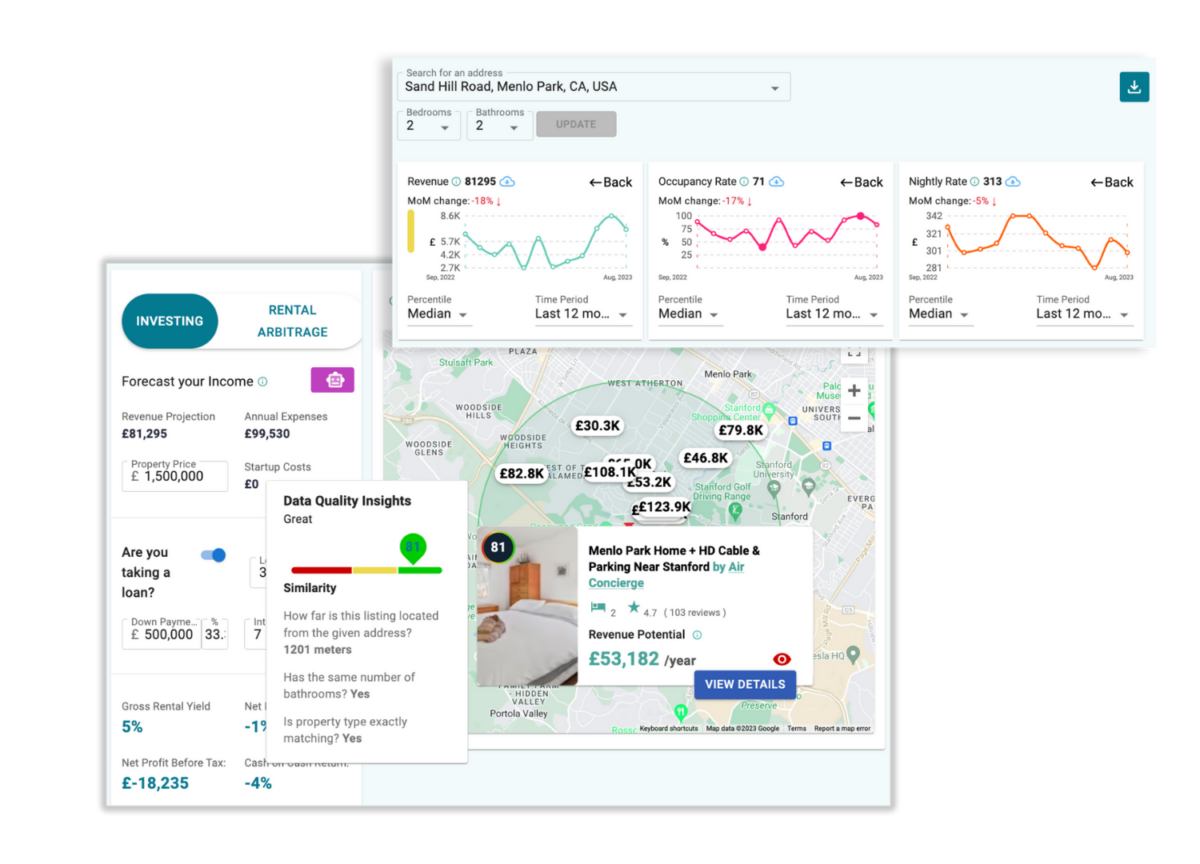
Wondering how to make the most money from Airbnb? Use the Airbtics Host Profit Calculator, a free Airbnb calculator to simulate your return on investment and cash on cash return, with any address worldwide.

Enter any address on earth to access the following data points for free with full transparency:

Airbnb Calculator by Airbtics
Airbnb Calculator

How much can I make on Airbnb?

A simple way to estimate your Airbnb revenue is by multiplying the year-round occupancy rate and your average daily rate of 10 Airbnb listings in your area. If they charge $150/night on average and achieve a 70% occupancy rate, it’s fair for you to assume that you will make around $150*0.70*365, which is $38,325 before expenses and taxes.

Airbnb Occupancy Rate x Average Daily Rate x 365 = Your Airbnb Revenue

Currently, there is a lack of good STR (short-term rental ) calculators in the market, and the ones that are available do not clearly show how they calculated the numbers. If you want to know how much can you make on Airbnb, then use Airbtics’ free Airbnb calculator to get a full transparent computation of your potential Airbnb earnings based on 10 to 40 comps.

We believe that making data-based decisions should be easy and accessible for you. Whether you’re an Airbnb host, property manager, property investor, estate agent, or anything in between, access valuable data most relevant to you and your business. 


Airbnb calculator - 2

3 Tips to Use Your STR Calculator More Effectively

1. Refine Comparable Listings: Review and remove comps that don’t match your property. Focus on those with reviews, close proximity, and similar property types to ensure accurate analysis.

2. Pull Additional Comps: If needed, use the Airbtics calculator to pull 30 more comps. This provides a broader data set, enhancing your market analysis.

3. Review Property Details: Check the details of each comp, including amenities, condition, and occupancy rates. This thorough review ensures a more accurate and insightful analysis.

How Does Airbtics Estimate Rental Income?

Airbtics is a short-term rental data platform providing historical, current, and forecasted rental income data. With the Airbtics app, you have access to over 15 million short-term rental listings from Airbnb and 54,000 visible markets globally. Since 2019, we’ve been tracking over 10 million rental properties weekly, which has enabled us to estimate rent of any address.

Our free Airbnb calculator has nearly 9,000 active monthly users–from Airbnb investors, hosts, property managers, real estate agents, and anyone who wants to know rental income on Airbnb investment property. Here are simple steps to use it:

We take our data accuracy seriously. Therefore, we update our data every week so our users can only get the fresh and latest Airbnb data from our app. Since 2020, the Airbtics data has 97% data accuracy in correlation with Airbnb’s financials. In fact, Awning’s Airbnb Estimator is powered by Airbtics. Learn more about our data accuracy..

Enter property address anywhere in the world

Enter the property address, select property type, choose the # of bedrooms, # of bathrooms, and whether the property has a pool. The provided details enhance the accuracy in generating optimal Airbnb estimated revenue.

You can also search directly in the Airbtics dashboard to calculate ROI of your property. All you need to do is to sign up for free.

What’s unique about our Airbnb Rental Calculator?

Our Airbnb profit calculator goes beyond the typical Airbnb calculators out there. With its notable features, you capture more insights to make smarter decisions.

  • Comps Transparency: Imagine you want to know how much money you can make from renting your house on Airbnb. This special tool not only tells you about houses nearby but also finds ones that are a lot like yours. That way, you can trust the information more and be sure you’re making a good choice for your rental.
  • Rental Arbitrage: This Airbnb calculator tells you how much money you’ll earn in Airbnb arbitrage by looking at things like how much you pay for rent, one-time costs, and monthly expenses. It helps you know if renting your place is a smart money move.
  • Mortgage Calculation: Let’s say you borrowed some money to buy your house, and you’re wondering if it’s a good deal. This free Airbnb estimator lets you put in the details, like how much interest you’re paying and how much you put down. It’s a calculator that helps you see if your house is making you money or not.
  • Comparison Tool: This free Airbnb tool is like having a magic way to see lots of different houses all at once. It helps you pick the best one by showing you how much money you can make, whether it’s all the money or just what’s left after paying bills. It helps you choose the one that will give you the most money. So, it’s like your money-making assistant!

Airbnb Investment FAQs

Is Investing in a vacation rental worth it?

Many studies have proved that housing is one of the most stable assets with a high average annual return. Note the annual return consists of home value appreciation and rental yield. By doing a vacation rental, you are renting it out for a shorter period at a higher price. This comes with a higher risk and seasonality, but the return is always higher. 


Are you investing in a good market? Have population, income, and property prices been inclining last couple of years? Is there good long-term rental demand? if so, you can always turn your vacation rental into a long-term rental. 

Where do I find short-term rental investment properties for sale?

Airbtics, Rabbu, The Offer Sheet, AirDNA, and Mashvisor are known companies providing property for sale data nationwide. All companies only provide such services to US investors, with the exception of Airbtics, which covers the UK, Australia, Canada, and European markets. Fill out the form below if you want to receive highly profitable deals. 

Should I list my short-term rental property on VRBO?

Airbnb is the biggest platform for booking vacation homes, but VRBO is more prevalent in some areas. Using our VRBO calculator, you can see how many VRBO and Airbnb listings are in your address. See how many VRBO listings are there in your market.

Airbnb Earning Calculator FAQs

Which expenses should I include?

Monthly Expense: You should include 1) repayment portion of mortgage 2) bills and utilities and 3) supplies fee. You should not include cleaning fees. Airbnb guests pay the cleaning fee, so it isn’t included in either ADRs or expenses. 

Yearly Expense: You should include 1) property depreciation 2) any other annual recurring fees. 

What is a one-off cost?

One-off cost is a one-time expense (legal fees, refurbs, transaction fees, mortgage fees etc) you pay when purchasing property and paying for renovations. The one-off cost (combined with the down payment) is used to calculate Cash on Cash return

I'm confused with profit tax

In most countries, you need to pay taxes on any profit generated from your properties. However, the way they calculate tax isn’t a flat rate. For example, in the U.K., you won’t have to pay tax on a certain amount of profit at first. 

In that case, you can first simulate the profit with 0% profit tax, which will then show you how much your revenue and expenses are. Then, you can calculate yourself around how much % of tax you need to pay from your profit, then put that % in the profit tax section. 

Categories
Airbnb Occupancy All About Airbnb

Airbnb Occupancy Rates & Top-ranking Boroughs in New York City

If you have ever heard of Frank Sinatra’s song “New York, New York” or watched films that have been set in New York City, then you can definitely understand why this particular city is recognizable around the globe! 

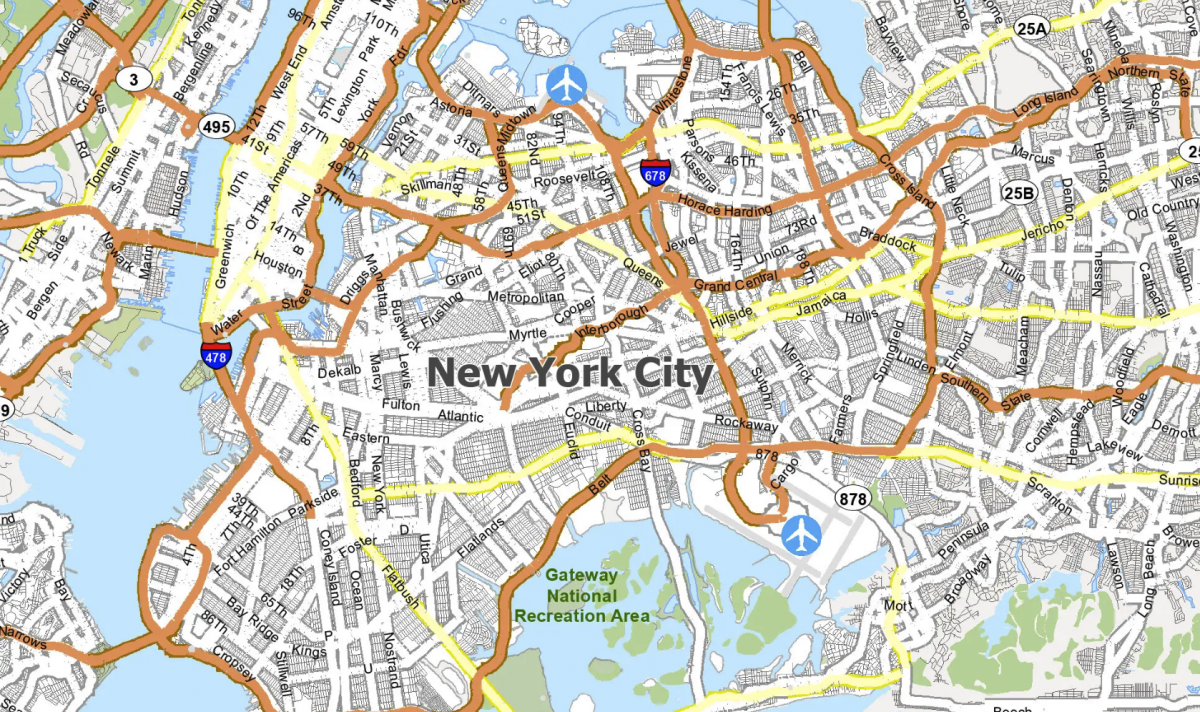
New York City is situated in the northeastern part of the United States and is ranked as the most populous city with a winning number of 8,177,025 according to the 2022 Population Statistics. Some of the most visited tourist attractions in New York City are Times Square, The Statue of Liberty, Central Park, The Empire State Building, and the list goes on!

Undoubtedly, this city has a lot to offer to both tourists and locals who are aiming to enjoy while earning money in a city that never sleeps. According to a recently published article about NYC’s economic outlook, rents in NYC have continuously increased without interruption this 2022.

This simply means that for a variety of reasons, more and more people are looking for apartments to rent that are situated within the heart of NYC. If you are one of the numerous dedicated hosts in the Airbnb industry who would like to invest in NYC, continue reading!

new york city
New York City Occupancy Rates & Monthly Revenue

In order to accurately check the average occupancy rates and monthly revenue of the 5 Boroughs in New York City, we utilized the features of Airbtics data analytics tool.

As presented on the column chart above, the 5 Boroughs in NYC have been categorized according to their respective occupancy rates and filtered into 2 beds / 2 baths – Apartment (Condo).

Bronx:

Occupancy Rate: 50%

Median Daily Rate: $127

Average Monthly Revenue: $2,064

Brooklyn:

Occupancy Rate: 55%

Median Daily Rate: $194

Average Monthly Revenue: $3,321

Manhattan:

Occupancy Rate: 50%

Median Daily Rate: $267

Average Monthly Revenue: $4,302

Queens:

Occupancy Rate: 49%

Median Daily Rate: $159

Average Monthly Revenue: $2,375

Staten Island:

Occupancy Rate: 52%

Median Daily Rate: $120

Average Monthly Revenue: $2,227

Frequently Asked Questions

1. New York Data-Sharing
Due to a recently amended law in NYC, all Airbnb and other short-term rental platforms are required to share data on Airbnb about listings and you (as a host). You will have to agree on sharing your personal data (such as your name, physical address, profile ID number, etc.) with the city, or else you won't be allowed to host short-term stays.

2. Obtain a special license or permit to operate. For more information, you can consult the City's official portal. 

3. Pay taxes, of course. Check out the official tax bulletin from NY State for more information.

4. Abide by other rules or contracts. This includes leases, condo boards, or rules established by tenant organizations. It's important to read your lease agreement or check with your landlord about further regulations.

Learn more about New York City's Legality & Regulations.

Typically, the months of July to September are the peak seasons in New York with an average of 57% occupancy rate.

According to Airbtics' Data, the average daily rate in New York is $205 for studio-type rooms, while for an apartment (Condo) is $204.

As of April 2022, Brooklyn has the highest occupancy rate of 55% with an average monthly revenue of  $3,321.

According to Airbtics' data, Airbnb hosts in New York City can earn up to $37,896 per year.

Based on Airbtics data, it shows that Airbnb in NYC is DEFINITELY profitable!

Let us try to set aside the fact that NYC has natural powers in attracting more visitors annually and focus on this: There is an ongoing rents surge that you can take advantage of! 

Yes, advertisements for rentals in Class A dwellings are currently banned. This is in violation of the Multiple Dwelling's Law restrictions on short-term rentals.

Though taxes may vary accordingly, some examples of taxes that are applicable to your listing are state sales and use tax, city hotel room occupancy tax, and the like.

Check out the official details from NYC's Department of Finance about hotel room occupancy tax.

It's a fact that amenities are one of the winning factors for most guests, which is why we have to be guided by a list of Airbnb must-have amenities.

According to a recent survey from Streeteasy, here are a few perfect amenities for New Yorkers:

- In-Unit Laundry

- Dishwasher

- Parking

- Centralized AC

- Shared Outdoor Space

how much can you make on airbnb

5 Boroughs in New York City

Bronx occupancy rates new york

Bronx

Bronx is the only district in NYC located on the mainland and is known for its hip-hop culture. Some of its most iconic attractions are The Yankee Stadium, Urban Zoo, & NYC Botanical Garden.

According to The Bronx Tourism Council, almost a hundred of thousand visitors are traveling to Bronx annually to discover the city and its beautiful hidden treasures.


Brooklyn

Brooklyn is situated on the southwestern Long Island of NYC and is commonly known for the iconic Brooklyn bridge, museums, botanical gardens, and the like.

In comparison to other boroughs, Brooklyn’s population is diverse as it currently has 2.5 million inhabitants.

This simply explains why it has the highest occupancy percentage for apartment types in the city. 

brooklyn airbnb nyc
manhattan new york city occupancy rates

Manhattan

Manhattan is a coextensive New York County and is considered as one of the world’s foremost financial centers. If you are looking for the #1 tourist attraction in New York City — it’s definitely the Statue of Liberty, located in Manhattan!

According to the Office of NY State Comptroller, the majority of NYC’s tourism jobs (57%)  are located in Manhattan. In addition to this, the hotel industry in this city has the highest wages of any county in the nation.

Queens

Queens is the second-largest among all the five boroughs in New York City and it has a variety of higher educational institutions.

As stated by Metropolis Moving, Queens has the most affordable housing & an average apartment rental can be as low as $2,090. 

queens new york city
Staten island new york city

Staten Island

Staten Island is often referred to as the “borough of parks” in NYC because of its tremendous natural spaces. It is also known for the ferry that transports New Yorkers & tourists from Manhattan for free!

Situated in the southernmost borough in New York City, Staten Island offers top-rated tourist attractions which captivate the hearts of tourists from all over the world.

Among all the other boroughs in New York cITY, Staten Island has the highest monthly revenue.

MORE OCCUPANCY RATES IN NEW YORK CITY?

Learn more about how to find Airbnb occupancy rates in the major cities of the world!

occupancy rates new york city

As seen in the gathered information, all the boroughs in New York City have their fair share of interesting target markets to thrive in an Airbnb business. Based on their respective occupancy rates for apartment (condo) types, it is safe to say that you no longer need to conduct in-depth research from time to time if you have an access to the excellent data analytics tool to support your business.

If you will base your assumptions on articles portraying poorly estimated costs or a wild guess, then you will certainly find inaccurate results. Since you already have an idea and vision of NYC’s occupancy rates for apartment types this 2022, don’t settle!

With the help of our all-in-one analytics service, you can vastly enhance your monthly revenue, create a comparison for each borough, add the appropriate amenities and so many more exciting features. Try Airbtics now and stand out among your competitors!

Categories
Airbnb Occupancy All About Airbnb

Comparison of Occupancy Rates in Texas Cities

airbnb occupancy rates in Texas cities

What’s the first thing that comes to your mind when you hear the word ‘Texas”? 

For many decades, Texas has been known for being a music capital in America. It is also known as the Lone Star State which is located in south-central America bordering a few parts of Mexico. But aside from its famous barbecue meals, hot climate, and historical sites, did you also know that it has one of the best cities to invest in an Airbnb in America

Despite the fact that the pandemic hit the world in 2020, the Airbnb industry in Texas still managed to rank as the third-highest earning business in the nation! To be specific, new Airbnb hosts in Texas made over $170 million in the last year of 2021.  

In this article, we will discuss important factors of investing in an Airbnb business within the Texas area and compare each city according to their respective occupancy rates. Let’s dive in and learn more!

Frequently Asked Questions

Yes, Airbnb is legal in Texas in some parts of the city - but not in residential areas. According to Texas Supreme Court, owners of Short-Term Rentals (STRs) are required to obtain an operating license. 

For more information, you can check the laws & restrictions on short-term rentals in Texas.

If you want to have an Airbnb business in Austin, you will be required to have a short-term rental license and pay a 9% quarterly hotel tax. 

On the other hand, if your property is inside the San Antonio City Limits, then you need to get a permit from the City of San Antonio to offer a short-term rental to guests. You will also be required to set up a Hotel Occupancy tax with their Finance Department.

In Dallas, although there are no regulations for Airbnb, all short-term rental owners have to register with the City of Dallas. For more information, you can check out the official document released by Dallas City Hall.

Finally, while short-term rentals in Fort Worth have not yet reinforced certain requirements, they are considering of implementing regulations for STR owners.

Typically, the months of May to July are the peak seasons in Texas with an average of 51% occupancy rate.

According to Airbtics' Data, the average daily rate in Texas is $159 for private rooms & $217 for studio-type rooms.

As of April 2022, Austin City has the highest occupancy rate of 40%.

Based on Airbtics data, we think that investing in Texas is an excellent option, as long as you find the right city to invest in!


Aside from the fact that Texas consistently draws tourists from all over the country because of massive events such as music festivals, having an Airbnb business in this state is a unique offer for all vacationers & business travelers.

Based on our in-depth research, if you are looking forward to maximizing your monthly revenue in Texas, San Antonio is ranked 1st on our list.

Since Texas has inclement changing weather in every season, it's best to come prepared! Some of the best amenities that you can add to your Airbnb are: 

- Barbecue griller & dining essentials (Texas is literally the barbecue capital, remember?)

- Fireplace / heating unit

- An outdoor pool

- Automatic Icemaker

Check out the rest of the Airbnb must-have amenities!

airbnb occupancy rates in Texas cities

Using the Airbtics data analytics tool, we were able to accurately get the occupancy rates of the 4 key cities in Texas!

As presented on the funnel chart above, the 4 main cities in Texas have been categorized according to their respective occupancy rates and filtered into 2-bedroom condos.

City of Austin

airbnb occupancy rates in Texas cities

If you know that Austin is the state capital of Texas, then you also have to know that this city is popular for its eclectic live-music scene of country, rock & blues! 

Based on our in-depth research, we’ve come across Downtown Austin and Allandale as one of the most ideal neighborhoods in the city of Austin.

These neighborhoods have thriving business & entertainment districts that  offers an exquisite experience for all visitors with various travel purposes. 

Occupancy Rate: 66%

Median Daily Rate: $205

Average Monthly Revenue: $4,504

City of Fort Worth

This particular city in Texas is proud of its rich and diverse cultural history – also known as ‘Cowtown’ for its legitimate cattle ranching industry!

Since it is currently illegal to put up an Airbnb business in residential areas in Fort Worth, you will be surprised to know that their average occupancy rate is still at 35%! The most recommended neighborhoods in Fort Worth are Fairmount and Arlington Heights.

These neighborhoods not only have a buzzing strip line with intimate restaurants (from sushi to Thai & Mexican food, yum!) — they also offer a peaceful and safe community.

In addition to this, it offers a wide range of fishing piers, playgrounds and arcades, and vintage-style cafes which most travelers with families prefer to go to.

Occupancy Rate: 65%

Median Daily Rate: $135

Average Monthly Revenue: $3,224

airbnb occupancy rates in Texas cities
how much can you make on airbnb

City of San Antonio

This city is a popular tourist destination – hence, it has the highest monthly revenue of $1,687 according to Airbtics data! Being the seventh-largest city in the USA, the City of San Antonio also has the largest concentration of Spanish colonial architecture in North America.

After a thorough investigation, it shows that the areas of Alamo Heights and Terrell Hills are some of the best neighborhoods in San Antonio City.

To sum it up, San Antonio’s economy continues to rise because of different business industries such as medical, energy, technology, and many others. Not to mention that there are numerous business & leisure travelers, too! 

Occupancy Rate: 64%

Median Daily Rate: $135

Average Monthly Revenue: $2,875

airbnb occupancy rates in Texas cities

City of Dallas

Dallas, TX

The City of Dallas is a modern metropolis located in the northern part of Texas. Known for its museum and parks, it is also the fourth largest city in Texas that attracts millions of visitors a year!

Based on the information that we gathered from various Airbnb hosts & recommendations from numerous guests, the neighborhoods of Preston Hollow and Deep Ellum were ranked as the best.

Aside from the available public transportation nearby, these neighborhoods were also marked with efficient access to the nightlife and historical trips. In addition to this, they were also rated as the most safest and affordable neighborhoods in Dallas!

Occupancy Rate: 60%

Median Daily Rate: $139

Average Monthly Revenue: $2,891

COMPLETE OCCUPANCY RATES IN EVERY CITY?

Head over here to find out about the cities with highest Airbnb occupancy rates & learn more!

comparison of occupancy rates in texas cities

Our basis for filtering out the best neighborhoods in each city was thoroughly gauged according to three factors: economic status, safety (lowest crime rates), and most visited tourist destinations.

These three are the main recipe for attracting more potential guests to increase occupancy rates!

Now that you have a brief background and accurate comparison of the cities in Texas, this does not mean that your research & analysis is over. While we portrayed accurate data for the occupancy rates of private rooms in Texas, results will definitely vary according to the type of bedrooms & amenities.

It is also important to note that these occupancy rates in Texas are in constant motion, which is why it’s truly efficient to have a data analytics tool that you can rely on. For the continuous success of your Airbnb business, don’t make a wild guess – try Airbtics!

Categories
Airbnb Occupancy All About Airbnb

Airbnb Analysis on Florida East Coast Beaches: Occupancy Rates, Best Neighbourhoods & more!

Florida is the short-term rental heaven, one of the most touristy states in the US. If you are sick of the cold winter, operating a vacation home in Florida may be a good excuse to visit there every winter. Of course, all while generating profitable cash flow to sustain your mortgage fees and all. It’s also easy to get a permit to run an Airbnb business here, most counties are quite friendly to Airbnb hosts. 

In this post, we’ll specifically showcase some of the important numbers you need to know if you want to start a vacation rental on the east coast side of Florida. The average 1 BD / BA condo in East coast Florida can generate $2,950. Their average occupancy rate is 52% and the average daily rate is $161 per night. 

While this may sound enticing to Airbnb hosts who would like to invest their time and money, you have to keep in mind that some neighborhoods may not offer an equal amount of return on investment.

The good news is that we’ve created this article to guide you through!

Airbnb Statistics in Florida East Coast Beaches - 1 BD / 1BA Condo

Collins avenue

2021 Average occupancy rate: 54%

2021 Median daily rate: $291

2021 Average monthly revenue: $4714

Miami Beach

2021 Average occupancy rate: 55%

2021 Median daily rate: $244

2021 Average monthly revenue: $4322

Downtown Miami

2021 Average occupancy rate: 55%

2021 Median daily rate: $240

2021 Average monthly revenue: $4291

American Beach

2021 Average occupancy rate: 59%

2021 Median daily rate: $196

2021 Average monthly revenue: $3978

Hollywood

2021 Average occupancy rate: 56%

2021 Median daily rate: $192

2021 Average monthly revenue: $3668

Sunny Isles Beach

2021 Average occupancy rate: 59%

2021 Median daily rate: $170

2021 Average monthly revenue: $3533

Jacksonville Beach

2021 Average occupancy rate: 59%

2021 Median daily rate: $170

2021 Average monthly revenue: $3514

Miami

2021 Average occupancy rate: 55%

2021 Median daily rate: $191

2021 Average monthly revenue: $3422

St. Augustine Beach

2021 Average occupancy rate: 63%

2021 Median daily rate: $147

2021 Average monthly revenue: $3198

Fernandina Beach

2021 Average occupancy rate: 55%

2021 Median daily rate: $123

2021 Average monthly revenue: $3180

South Ponte Vedra Beach

2021 Average occupancy rate: 61%

2021 Median daily rate: $135

2021 Average monthly revenue: $2878

Delray Beach

2021 Average occupancy rate: 48%

2021 Median daily rate: $176

2021 Average monthly revenue: $2774

Fort Lauderdale

2021 Average occupancy rate: 54%

2021 Median daily rate: $148

2021 Average monthly revenue: $2744

Neptune Beach

2021 Average occupancy rate: 52%

2021 Median daily rate: $147

2021 Average monthly revenue: $2723

Daytona Beach

2021 Average occupancy rate: 49%

2021 Median daily rate: $163

2021 Average monthly revenue: $2720

Ormond Beach

2021 Average occupancy rate: 50%

2021 Median daily rate: $153

2021 Average monthly revenue: $2649

Cocoa Beach

2021 Average occupancy rate: 64%

2021 Median daily rate: $111

2021 Average monthly revenue: $2626

New Smyrna Beach

2021 Average occupancy rate: 49%

2021 Median daily rate: $217

2021 Average monthly revenue: $2620

Butler Beach

2021 Average occupancy rate: 58%

2021 Median daily rate: $114

2021 Average monthly revenue: $2613

Wynwood

2021 Average occupancy rate: 52%

2021 Median daily rate: $166

2021 Average monthly revenue: $2457

Jupiter

2021 Average occupancy rate: 38%

2021 Median daily rate: $145

2021 Average monthly revenue: $2288

Near Miami Internatinoal airport

2021 Average occupancy rate: 56%

2021 Median daily rate: $134

2021 Average monthly revenue: $2242

West Palm beach

2021 Average occupancy rate: 47%

2021 Median daily rate: $122

2021 Average monthly revenue: $2167

Vero Beach

2021 Average occupancy rate: 48%

2021 Median daily rate: $118

2021 Average monthly revenue: $2088

Jensen beach

2021 Average occupancy rate: 41%

2021 Median daily rate: $158

2021 Average monthly revenue: $2071

Melbourne

2021 Average occupancy rate: 53%

2021 Median daily rate: $107

2021 Average monthly revenue: $2039

Playalinda Beach

2021 Average occupancy rate: 49%

2021 Median daily rate: $180

2021 Average monthly revenue: $1577

airbnb occupancy rates Florida

Through this accurate & reliable information, you can compare each listing in order to strategize properly and answer the most important question: is it going to maximize your revenue in the long run, or not?

Frequently Asked Questions

You need to get a short-term rental permit by the Florida Department of Business and Professional Regulation (DBPR). However, according to our own Airbnb listing analysis, more than 50% of Airbnb listings in Florida didn't submit their license information to Airbnb. Pshhh…

According to our data analysis, the first half of the year, January - June, has higher occupancy rates than the latter half of the year. However, the average nightly rate is higher during the latter half of the year.

$251 per night in 2021. It's $191 for 1 bd / 1 ba condo. 

If you are looking for the highest revenue, the coastline that is close to Miami beach is a good bet. For example, Collins Avenue, Miami Beach, Downtown Miami, and Hollowood have the highest average revenue for 1bd / 1 ba condos. 

Cocoa Beach, St. Augustine Beach, South Ponte Vedra Beach, American beach, Jacksonville Beach, and Sunny Isles beach have an average occupancy rate of 59% or higher. 

Zillow or Redfin has the most amount of properties available for sale. Alternatively, Vroilo and Awning are specialized vacation home online brokers. You can also speak with realtors in the areas. 

First of all, having a pool will increase your RevPAR pretty efficiently. Our data says you will make 44% more, in the case of Miami, if your listing has access to a pool. Secondly, A hot tub can add about 42% of revenue. Making your listing pet-friendly will increase your RevPAR by 12% - is it worth all the deep cleaning you need to do? Up for you to decide!  

Where is the best beaches in East Florida for short-term rental property investment?

When it comes to picking high net rental yield investment properties, it’s less about the area but it’s more about the specific properties for sale that you choose. But the data analysis we are going to show could guide you on which areas to look at more carefully. it’s better to start in upcoming or undervalued areas.

airbnb occupancy rates Florida

So, this image shows that the property price tends to get higher in the Miami area, but interesting point here is that the property price isn’t that high in Jacksonville area, which has similar amount of average annual Airbnb revenue. This means there is a good chance that you can find a relatively cheap property up in the north east coast, and run an Airbnb to generate high cash return. 

CANT SEE YOUR PREFERRED CITY IN FLORIDA?

Check out the average Airbnb occupancy rates by city now! 

If you are looking forward to running your Airbnb business in the long term, strategizing your occupancy & daily rates are just as important as maximizing your revenue.

Thanks to technology, you can analyze all that using an accurate short-term rental analytics that can help you estimate your earnings!

airbnb london revenue
how much can you make on airbnb

Airbnb Average Occupancy Rate in Florida East Coast Beaches - 1 BD / 1BA Condo

airbnb occupancy rates Florida

The above bar chart shows the 2021 average occupancy rates of 1 bedroom / 1 bathroom condo in each of the destinations.

Having an estimated percentage of your occupancy rate is one of the most essential key performance indicators for hosts in the Airbnb business.

This refers to the proportion of days in a month for which your property has bookings.

Primarily, as seen on the bar chart, Cocoa Beach, St.Augustine Bech, South Ponte Vedra are the top 3 highly occupied destinations. Jupiter Beach, Jensen Beach and Vero Beach are not so doing well! Should you avoid them? Well, it depends, you might find a good deal in that city, or maybe it’s just the 1 bed / 1 bath condo that isn’t doing so well in these regions. You still need to do further analysis. 

Categories
Airbnb Investment All About Airbnb

Fractional vacation home ownership provider reviews (Pacaso, Kocomo, Everomes, ReAlpha etc)

Do you want to take advantage of the rapid rise of the home-sharing economy but don’t have the capital to invest?

In 2022, you can be an Airbnb or vacation homeowner with $100, via investing in a fractional short-term rental fund. They will allow you to buy a share of vacation property similar to buying a share of a company. Keep on reading to learn more!

Table of Contents
    Add a header to begin generating the table of contents

    Why invest in Short-term Rentals?

    Before diving deeper into fractional short-term rental funds, let’s see why one would want to invest in vacation homes. 

    The home-sharing economy is rapidly growing even during the pandemic, in fact, the pandemic was the opportunity for Airbnb to take a big share of hotel businesses. In major staycation destinations in the US, we have observed a 32% – 51% surge in 2021 alone. 

    fractional vacation home ownership

    A typical long-term rental property generates 1-5% a year but a short-term rental produces 5-25% a year. It is riskier and less passive than managing long-term rentals, but this can be an attractive option for someone who has retired and is looking forward to doing a small amount of work while befriending guests! 

    How do I choose the right fractional vacation home ownership company? 

    Companies like Pacaso, Here, Everomes, Kocomo, and PartBnb allow you to purchase a share of a specific vacation home. This gives you full control of choosing a vacation home for investing.  On the other hand, ReAlpha is a short-term rental fund, so they’ll manage a bunch of short-term rental portfolios and you are buying a fractional share of the portfolios.

    One of the benefits of investing in a fund is a lower risk since they will hedge their risk by investing in multiple properties. 

    fractional vacation home ownership

    As I mentioned earlier, you can invest with as little as $100 for Here or $1,000 for ReAlpha. Yet, if you are looking to have more “real” ownership (also known as vacation home co-ownership) like staying at the property you partially own, Picasso or Everomes offer what you need. You have to purchase at least 15% of the entire property price, yet you can stay in those properties for up to 6 weeks a year. If staying at a vacation rental a few weeks a year is what you need, these offers may work better. 

    Looking for Partial vacation homeownership in the US & Mexico?

    Kocomo probably is the best bet if you are looking for somewhere close to the US. It is a Mexico-based startup with about a $60M fund available for investing in vacation rentals. They currently have 27 vacation rentals in both Mexico and Miami. 

    fractional vacation home ownership

    Here.co was only founded in 2022, and they have secured $2 million in funding in a pre-seed round,  and they will start investing in Florida vacation homes. You can start investing with as little as $100, but they only have 1 property for investment currently! PartBNB focuses on Caribbean vacation homes, and they have 3 upcoming investment opportunities. 

    how much can you make on airbnb

    Investing via fund? 

    ReAlpha was founded in 2020 founded by Giri Devanur who has experience in taking a company to NASDAQ in the past. This company has a $6 million fund as of now, with 40 employees based in Ohio. They are planning to invest in Texas primarily. 

    fractional vacation home ownership

    You can invest with as little as $1000, but here’s a thing, you are not investing in a specific vacation home, but you are investing in the fund. They will purchase a bunch of vacation homes on your behalf and generate profits and will share that with you. We have written an in-depth review of ReAlpha below. 

    Looking for Shared ownership of Luxury vacation homes? 

    fractional vacation home ownershipPacaso focuses more on luxury short-term rentals, and they have around 85 vacation homes that investors can choose from, as of 2022 March. The minimum amount of investment you need to make starts from $500,000 for 15% (⅛) of ownership. Second home shared ownership in the US just got easier with Pacaso! 

    Everomes focuses on European holiday homes, and they have about 55 different investment options. You will share a vacation home investing with 7 other people, so you will own 15% of the ownership. They have homes in beautiful Alpes and the Mediterranean sea. If you are looking to have a luxurious stay in Europe while generating some passive income, Everomes could be your best bet! 

    Is reAlpha a good investment? 

    Here are our reAplha reviews.  Once you sign up, they will ask you a series of questions, such as your name, address, and if you are an accredited investor or not. You will be able to invest even if you are not an accredited investor, so don’t worry. They’ll ask how many shares you’d like to invest and then generate a contract for you. That is it! 

    This was quite an obscure process since we want to exactly know which properties they will be investing in before signing a contract. So we dug into the contract a little deeper, and there were a few fine prints, which other Reddit users have discovered. 

    We have looked into a few communities to understand what the actual users say. There seem to be a few caveats. 

    realpha rental investmentOne anonymous user from Reddit warns: “I was super excited about ReAlpha till I spent the time reading the Reg A+ Circular. Investing in ReAlpha Asset Management is not the same as investing in ReAlpha Tech. Read pages 2 & 37 of the Circular: Investors who invest in the Reg A+ offering are putting up nearly all the money (~90%) for less than 16% ownership.

    ReAlpha Asset Management only owns a few Airbnb homes but is selling shares at a valuation of $400 million. This is technically not illegal because it is disclosed, however, they are taking advantage of people’s laziness to do their own due diligence.” 

    short-term rental reviewsAnother anonymous user from Reddit stated: “Buy equity in specific properties just like you would buy stock or shares in a company. We pair you with a few like-minded investors to form a syndicate, so together you can cover the down payment. Investment properties usually require a 25% down payment, but with reAlpha it’s 10% because of our relationship with lenders, making it more affordable. reAlpha is also part of each syndicate, retaining 51% ownership of each property so you know our interests are always aligned with yours.” 

    Conclusion 

    short-term rental investment fund review

    Fractional homeownership isn’t something new. There have been many shared ownership for short-term rentals, even private equity-like KKR or Blackstone have been investing in short-term rentals and making them available to their exclusive investors. However, with the rise of Airbnb, investing in short-term rentals is getting easier and more attractive with these new innovative startups. 

    Did you know that you can find out the return on investment of a vacation home with actual data points?

    Sign up to our app now! Some of these companies are powered by Airbtics data as it allows investors to understand the market.

    Categories
    Airbnb Occupancy All About Airbnb

    Latest Airbnb Data in London: Occupancy Rates, Legality, Best Neighbourhoods & more!

    The beautiful capital city of England & United Kingdom – London, is one of the most visited cities in the world. Despite the restrictions implemented amidst the pandemic, this city remains to be one of the most popular destinations visited by numerous travelers across the globe.

    Relatively, as travelers look for their ideal place to stay in London, the demand for Airbnb is expected to rapidly increase. According to iProperty management, over 50% of guests prefer to stay at an Airbnb than a traditional hotel for various reasons and an experienced host can earn an average of $10,000 annually.

    While this may sound enticing to Airbnb hosts who would like to invest their time and money, you have to keep in mind that some neighborhoods may not offer an equal amount of return on investment.

    The good news is that we’ve created this article to guide you through!

    Frequently Asked Questions

    Yes, it is! The government only allows Airbnb hosts to run a short-term rental in a residential area for 90 days a year.

    A planning permission is ONLY required for property owners in London who are putting up their short-term letting for up to more than 90 nights in a calendar year.

    The first thing that you need to do is apply to your local council for a planning permit and they will provide the succeeding steps & requirements.

    Typically, the month of September is the highest season in London with an average of 53% occupancy rate.

    According to Airbtics' Data, the average daily rate in London is £139 for private rooms & £92 for studio-type rooms.

    As of April 2022, Islington has the highest occupancy rate of 71%.

    Yes! We think that this is a great idea, as long as you find the right location to invest in!


    It's important to know that there is also a huge number of business travelers and students in London - so even if your Airbnb doesn't flourish, you will still have a lot of fallback options.

    Based on our in-depth research, if you are looking for maximizing your revenue in London, Hounslow is ranked 1st on our list with annual revenue of £46,308.

    As of April 2022 when I conducted the research for London boroughs, Sutton has the least number of studio-type rooms in London's Airbnb listings. This means that there are only a few Airbnb hosts offering that particular type of listing in the said area.

    According to our research, Bromley is one of the areas that ranks lowest on both annual revenue and occupancy rate in London. It was estimated to have the lowest annual revenue of £4,968 and an occupancy rate of 11%.

    airbnb occupancy rate

    airbnb occupancy rates London

    A heatmap is a data visualization technique that helps users to comprehend and analyze the data presented in various colors.

    For instance, this map of London above represents the boroughs with the highest & lowest annual revenues. 

    Primarily, Airbnb hosts like you will benefit from using the heatmap by identifying which are the highly profitable neighborhoods in your area.

    Through this accurate & reliable information, you can compare each listing in order to strategize properly and answer the most important question: is it going to maximize your revenue in the long run, or not?

    If you are looking forward to running your Airbnb business in the long term, strategizing your occupancy & daily rates as well as learning where to invest in property in London are just as important as maximizing your revenue.

    Thanks to technology, you can analyze all that using an accurate data tool that can help you estimate your earnings!

    airbnb london revenue
    how much can you make on airbnb
    airbnb listings london

    As of April 2022, here is the statistics for Airbnb listings in London!

    This kind of market-specific information is important especially for hosts like you – whether you have an entire property available, or just wish to rent out private or shared rooms.

    Through this, you can easily strategize & tap into the huge Airbnb market!

    Based on our research, the most preferred listing in London is private rooms with a total number of 5,862.

    Total number of listings: 18,398

    • Private rooms: 5,862
    • Studio: 422
    • 1 Bedroom: 2,602
    • 2 Bedrooms: 2,058
    • 3 Bedrooms: 729
    • 4 Bedrooms: 311
    • 5 Bedrooms: 109
    • 5+ Bedrooms: 48
    • Hotel Rooms: 130
    • Shared Rooms: 115

    Having an estimated percentage of your occupancy rate is one of the most essential key performance indicators for hosts in the Airbnb business.

    This refers to the proportion of days in a month for which your property has bookings.

    Primarily, as seen on the stacked bar chart, London’s highest occupancy rate in 2021 is during the month of September with a percentage of 53%.

    london occupancy rate
    • March 2021: 26%
    • April 2021: 30%
    • May 2021: 31%
    • June 2021: 34%
    • July 2021: 34%
    • August 2021: 42%
    • September 2021: 53%
    • October 2021: 43%
    • November 2021: 44%
    • December 2021: 45%
    • January 2022: 30%
    • February 2022: 39%
    airbnb london daily rate


    Here is a stacked row chart that contains the nightly rates in London. It’s noticeable that since March 2021, there has been a great increase!

    Relatively, the month of June ranks first with the total amount of £147, while the month of March is ranked least with the total amount of £119.

    • March 2021: £119
    • April 2021: £122
    • May 2021: £143
    • June 2021: £147
    • July 2021: £146
    • August 2021: £141
    • September 2021: £139
    • October 2021: £141
    • November 2021: £143
    • December 2021: £145
    • January 2022: £143
    • February 2022: £142

    Finally, here are the top 5 highest & lowest boroughs in London based on their respective annual revenues.

    Top 5 Maximum Revenue:

    1. Hounslow – £46,308

    2. Lewisham – £32,9523

    3. Islington – £25,584

    4. Kingston upon Thames – £24,936

    5. Camden – £22,968

    Top 5 Minimum Revenue:

    1. Bromley – £4,968

    2. Greenwich – £5,592

    3. Enfield – £7,200

    4. Newham – £7,260

    5. Waltham Forest – £7,320

    highest and lowest revenue

    LOOKING FOR OCCUPANCY RATES IN OTHER CITIES?

    Check out the highest Airbnb occupancy rates 2022!

    Download London Boroughs Spreadsheet now!

    Airbnb data in london

    Based on in-depth research, this document contains accurate data on London boroughs for studio-type rooms including the annual revenue & occupancy rate using Airbtics tool. 

    Here is a comparison chart between Airbnb & Hotels in London according to their occupancy rates from August 2021 to February 2022. 

    Based on this data, we can say that hotel occupancy rates in London are ranking higher in comparison to Airbnb. 

    Hotel Occupancy Rates:
    MONTHSREVPAR
    August 2021£63.97
    September 2021£82.7
    October 2021£95.22
    November 2021£100.76
    December 2021£82.08
    January 2022£42.69
    February 2022£76.88
    Airbnb Occupancy Rates:
    MONTHSREVPAR
    August 2021£59.22
    September 2021£73.67
    October 2021£60.63
    November 2021£62.92
    December 2021£65.25
    January 2022£42.9
    February 2022£55.38

    Download Airbnb vs Hotel Occupancy Rates Spreadsheet now!

    airbnb vs hotel london

    Based on in-depth research, this document contains an accurate comparison between Airbnb and Hotel Occupancy Rates in London using Airbtics tool. 

    London Gross Rental Yield

    Here is a comparison chart between Islington and Hounslow. Based on our spreadsheet about London Boroughs, you would know that these two are ranking first on both occupancy rates & annual revenue among all the boroughs in London.

    As presented on this chart above, Hounslow has a higher gross yield of 2.27% which means that it is the best borough to invest in London! Please take note that during this research, we have filtered the properties in studio-type rooms. 

    BoroughsStudio PriceAnnual Revenue
    Islington, London£138,000£1,824
    Hounslow, London£170,000£3,859
    london boroughs annual rate

    After a thorough investigation, we have come to the conclusion that as long as you have chosen the right location to invest in, it is definitely recommended to try investing in London! Aside from the fact that it is one of the most popular destinations in the world, the opportunity to maximize your revenue is limitless. In addition to this, Airbnb hosts like you should consider using a data analytics tool in order to get along with the fast-shifting industry. This will not only help you strategize in London but anywhere in the world, such as in other best buy to let locations in the UK!

    Categories
    All About Airbnb Hosting Tips

    Real Estate Industry Trends That Will Shape 2022

    Table of Contents
      Add a header to begin generating the table of contents

      Mortgage Rates

      real estate mortgage trend2021 was the lowest housing inventory year in recorded history, but 2022 has shown growth in sellers listing homes. This year, mortgage rates are expected to hover at an average of 3.3 percent, with a projection of 3.6 percent by the end of the year. While a good amount of homes are popping up on the market and rates are rising, it can make for a good or bad scenario, depending on income. 

      Location

      The location of where you live used to be of high importance when it came to renting or buying. Properties that were close to work, loved ones, or grocery stores were a must when settling on a home. Sometimes, buyers would make certain compromises if their home wasn’t close to their preferred locations. However, this doesn’t look to be the case anymore. With the flexibility to work from home becoming the new norm, moving somewhere close to your job isn’t as big of a priority for many. real estate industry locationAccording to Realtor.com, as of 2021, many buyers preferred remote work and considered it when purchasing their new home. The increase of convenient services, such as delivery or entertainment, has made the choice of location easier. You will more than likely see a spike in homes purchased in less densely populated areas where congested traffic is thinner and better tax rates are a possibility.

      Virtual Tours

      When a tenant or homebuyer had to see a property in the past, it would’ve had to be done physically. Ever since the pandemic, certain adjustments were made in order to make home viewings possible. While the outbreak of COVID-19 became more severe, in-person meetings couldn’t happen,  but instead of removing properties from the housing market, many realtors began to utilize technology for remote tours. A study has shown that looking for homes or apartments online is far more practical than taking an in-person tour. While this doesn’t have to be the norm moving forward, it possesses a lot of perks for realtors and buyers.virtual tour real estate industry trend Scheduling times don’t have to be as tight, as room for more viewings can be done virtually. It’s helpful for anyone living outside the city or town they’re planning on moving to, as they’ll be able to see the home from a virtual tour on their computer screen. Realtors can expand their showings through virtual tours, as it can reach a wide selection of potential buyers.

      how much can you make on airbnb

      Newer Generations

      Now that millennial generations will be looking for their first homes, the industry will have to prepare for their new values. Properties that feature tech integrations and modern updates tend to be more attractive to younger homebuyers. new generation industryWhether the home or apartment is for rent or purchase, accessibility to Wi-Fi and other technological advancements, such as motion sensor lights, remote access lights, and smart thermostats, is important. Our friends at Globe Property Management in Winnipeg recommend making upgrades to ensure efficiency and maximum comfort. 

      You can expect more properties will have these added amenities, as they’re more appealing to younger buyers and could lower the cost of specific utilities. 

      Mental Health Spaces

      The stress that the pandemic has caused individuals was prominent, to say the least. Highlighting homes designed with health and wellness in mind will appeal to those looking for a calming environment after the last two years.

      mental health space real estate trendAccording to Zillow, spaces for meditation or reflection, reading nooks, spa-inspired bathrooms, earth tones, and natural lighting will be among many Zen-like features that home buyers will be looking for in 2022. 

      ESG Focus

      ESG (Environmental, Social, and Governance) practices have been something sorely lacking in the real estate industry, until now. You can expect attention to form around ESG-focused developments, like materials that offer carbon emission savings compared to concrete or steel.

      esg real estate industry trendThis is an appealing factor for buyers that are environmentally and socially conscious, and it’s becoming the new strategy in residential and commercial projects.

      With so many housing opportunities on the rise, now is as perfect a time as ever to buy, or to rent out properties. Airbnb is a great way to utilize any extra property, or newly purchased spaces. Knowing the inner workings of renting out your property can be tricky. Knowing the inner workings, like average utility prices or differences between authorized vs. unauthorized basement suites, can save you a lot of trouble when designing a smart investment plan. Choose wisely when looking for a property and go with the best.

      Categories
      All About Airbnb Hosting Tips

      Maximize Your Profit This 2022: Top Airbnb Amenities

      As the Airbnb Industry rapidly evolves and competitors are rising in the market, it’s certainly important to properly strategize your rank in the business. In this article, we will discuss how you can focus on maximizing your return on investment, worry less about dominant competitors, and aim to have the best Airbnb amenities this 2022.

      If you really want to know more successful ways that can help boost your Airbnb business’s overall performance in the market by investing in the top trending amenities, continue reading!

      Why Invest in the Best Airbnb Amenities?

      top airbnb amenitiesTry to think about this: before you started your Airbnb business, what kind of amenities did you prefer to serve your guests? Even if you were on a limited budget, you probably thought that it would be ideal to offer quality amenities that match your financial capability. 

      Similarly, if you are about to introduce & launch your business in the entire world, don’t you want to kick off by being recognized as one of the bests? According to Airbnb News, despite the fact that we are currently amidst a pandemic, Airbnb is still leading the travel revolution for a variety of reasons. 

      This means that while more travelers are working remotely and are slowly transitioning to the new normal, their chances of traveling & booking in an Airbnb is scaling up. In this case, we expect that travelers won’t just book “any” kind of accommodation that they see online. 

      When we refer to the ‘best’ amenities for your Airbnb, this does not necessarily mean that you have to spend a hundred bucks for one item that will go to waste. You’ll be surprised to know that there are a handful of affordable options for high-end Airbnb amenities that will suit your budget and please every guest that walks right through your doorstep.

      Best Airbnb Amenities for Families with Kids

      As an Airbnb host, it’s extremely essential to anticipate different kinds of travelers from all over the world with various sets of needs. Expect excellent feedback once you offer the following amenities for families with kids:children airbnb amenities

      • Child-friendly furniture

      If your Airbnb is a 3-bedroom house that is used for family trips, you might want to consider adding child-friendly furniture such as cribs, a table & chair, a high chair, or a dollhouse. The best way to figure this out is by communicating with your guests! kids furniture amenities

      • Complimentary Sweet Treats

      Turn up your game by giving all guests a sweet time, including their kids! Aside from milk & cookies, you can also add chocolate macaroons, cupcakes, fruits, or gummy bears.complimentary sweets for kids

      • Fun Activities

      Keep your guest’s children entertained and boost their creativity by providing sufficient paper & coloring materials.kids airbnb activities

      • Childproofing

      Help your guests feel worry-free about hard edges or electrical sockets and provide them with childproofing amenities along with other safety gear for their children.childproofing amenities

      Best Airbnb Amenities for Remote Workers

      If you try to look from a traveler’s point of view, you can easily identify their needs and wants during their stay in your Airbnb. For instance, if a remote worker would like to book a room for a week or two, they would surely look for the following listings in your business:

      • Add a monitor & a comfortable chair as a package in the dedicated workspaceairbnb workspace amenities
      •  Upgrade your internet plan & add WiFi expanderswifi expanders airbnb amenities
      • USB ports in outlets & end tablesaddport1
      • No power interruptions (with power generator available)no power interruptions airbnb

      Best Airbnb Amenities for Pet Owners

      According to the data research team from Airbtics, making your listing “pet-friendly” is one way to instantly boost occupancy and daily rate in most areas in the world. Although this will increase your cleaning costs and could damage your furniture or floor, it’s worth it to take a look at how much you can make more by making your listing pet-friendly. Check out the following amenities:pet owners amenities

      • Pet-friendly furniture coverspet furniture
      • Towels & rug to wipe off pawspet rugs and towels
      • Extra cleaning supplies

        Consider providing some cleaning supplies such as pet litter spray, paper towels & garbage bags. These will be very useful for pet owners!pet cleaning supplies

      • Pet bowls for food & water
        pet bowl amenities

      Best Airbnb Amenities for Mid-term & Long-term Stay Guests

      long-term and short-term airbnb stayAside from your daily guests and walk-ins, you might also want to consider the desired amenities of guests who have booked a mid-term & long-term stay in your Airbnb. Here are some of the best amenities that you can provide for them:

      • Washing Facilities

      Guests who plan on staying a little longer than usual would most likely prefer to do their own laundry. If you often get mid-term or long-term bookings, you can purchase an affordable washer/dryer without breaking your bank. This can give a high ROI in some markets!washing utilities

      • Kitchen Facilities

      You can equip your kitchen by purchasing low-cost facilities such as a mini-refrigerator, a coffee maker, a mini-microwave, and some basic utensils. This small investment will leverage your listings when guests look for a place with a kitchen.kitchen amenities

      • Increase Entertainment Options

      Aside from having television & streaming services, you can increase your guest’s entertainment options by adding a foosball table or board games.entertainment utilities

      • Boost the outdoor experience of your guests by adding a hot tub!hot tub
      how much can you make on airbnb

      Methods to Discover the Highest ROI Amenities for your Market

      increase airbnb ROISpeak to your Guests

      Maintain your connections with guests & get their insights! In comparison to hotels & other accommodations, the edge for Airbnb hosts like you is immense because of one thing: a sense of personal connection.connection with airbnb guests

      Try the Top-performing Nearby Airbnbs or Hotels 

      One way to gain techniques for selecting the best amenities for your business is to visit the most popular Airbnb or hotel in your area & observe their strategies. Through this, you can learn more and have insights on how you can further improve your Airbnb.top-performing airbnb

      Check Reviews from Other Listings

      By checking the reviews from other listings on the internet, you can have ideas on the most popular amenities that are in demand. For instance, reviews left by guests regarding the amenities that helped them enjoy their stay more or disappointed them will convince Airbnb hosts like you to make proper decisions.airbnb reviews

      Use A Data Tool

      Although you can always research for numerous articles that talk about listing recommendations, the answers will definitely vary from one place to another. If you want to access accurate data, Airbtics is designed to present exactly that!airbnb analytics

      This is the data portrayed from the dashboard of Airbtics – an Airbnb analytics platform. As seen in the photo, the market overview of Miami has a total number of 7,907 listings. Based on the accurate data presented, this suggests that adding a pool amenity has increased RevPAR (Revenue Per Available Room) by 44%, which is equivalent to a $19,000 increase in annual revenue!

      market overviewOn the other hand, if you are thinking of adding a hot tub instead of a pool, you can see that this will increase your RevPAR by 42%, which is equivalent to $18,500. In that case, if adding a pool amenity costs MORE (at least $30,000) and will only reciprocate a small amount of ROI, then you can definitely think about purchasing a luxury hot tub (for as low as $2,000) instead.

      Nowadays, using this kind of market-specific data is essential. Why spend your time manually looking into your competitor’s listings when you can use a powerful data tool like Airbtics?

      Check Guest’s Reviews & Suggestions

      guest reviewsJust like in any other business, reviews are crucial – whether they are categorized as the best or the worst. This is why if you really want to speed up your game in the Airbnb business, maintaining your guests’ positive feedback (online or through word of mouth) is VERY important. 

      Relatively, you can also upgrade your listings based on your guests’ ratings and reviews. 

      For instance, if you launched your Airbnb business with limited lights in the area and one of your guests left feedback saying: “This place is nice overall, however, I found it a little sad because there were only a few lights along the hallway”, then you might want to address that by adding more lights in your Airbnb.

      Upgrade your Listing After Adding New Amenities 

      Once you have gathered all your resources and crafted innovative ideas for adding new amenities, don’t forget to upgrade your listing! Through this, people can easily browse all the available amenities in your business.

      Available Listings

      By going through the available listings on your Airbnb, your guests can primarily determine whether your listing matches exactly what they need. Therefore, it’s important to invest in the best amenities that target all kinds of travelers – just to be sure that you’re offering close-to-perfect amenities!upgraded listings

      Conclusion 

      In a nutshell, if you want to smell the sweet scent of success in the Airbnb business & be acknowledged as one of the bests, you have to upgrade your listings accordingly.

      We know that success isn’t something that can happen overnight. But if you will base it on the listings that are performing well in the market & apply the mentioned methods, you can guarantee success in a matter of seconds.

      Free Webinar

      Learn Airbtics in 7 Minutes

      Revenue and market analysis Tips and Best Practices!
      Airbnb Data
      Airbnb Data

      ARE YOU IN?

      Get Access to our weekly data-driven airbnb report!