fbpx
🎉 FREE WEBINAR - July 24th, 11am / 8pm CET - Learn Airbtics in 7 Minutes - Revenue and Market Analysis Tips and Best Practices!
Categories
Airbnb Occupancy All About Airbnb

Airbnb Occupancy Rates in Italy: Top 20 Cities for Airbnb Investment

airbnb occupancy rates italy

Italy is one of the most beautiful cities as well as the most visited country in Europe. This country offers breathtaking destinations, fascinating ancient culture, and of course, we can’t forget to mention its exquisite cuisine that can easily make everyone’s mouth watery!

Furthermore, an Airbnb property investment in Italy can be a profitable business idea if we consider that this country is not only beautiful but also one of the largest economies in the Eurozone.

Yet, before investing in a property in Italy, you must analyze deeply which city to target and determine the profitability based on Airbnb’s important key metrics. 

In this article,  you will find the top 20 best cities for Airbnb in Italy along with their respective occupancy rates, monthly & yearly revenue, average daily rates (ADRs), and more. Continue reading to learn more!

Why Invest in an Airbnb Property in Italy?

airbnb occupancy rates italy

2,500 years. Its natural landscapes will easily make you fall in love and it offers the most delicious cuisines in the world. But what advantages does this country have for investors? Here are  the top reasons why you should invest in an Airbnb property in Italy:

  • Italy is a country of great tourist importance

In fact, Italy is an attractive country that ranks high when it comes to tourism, welcoming around 65M tourist arrivals every year. Considering that almost all Italian cities are touristy areas, it can really become a profitable business for investors who want to cater to tourist accommodations.

  • World’s top economy

Aside from being one of the most visited countries, Italy is also a top economy, ranking 8th as the largest economy in the world and 3rd in the Eurozone. Being a country that is open to foreign investment, there are many multinational companies as well.

  • Airbnb investment profitability in Italy

Italy is certainly a profitable country for Airbnb investments! As a matter of fact, in Rome, a 1 bedroom apartment has an average occupancy rate of 89% and can generate up to €38,374 annually as confirmed by Airbtic’s data!

Still not sure about Italy? There’s another advantage of being a host in this country: an automated tax collection tool that will help you a lot on your journey! As a result of a recent partnership, Airbnb introduced a tool that automatically collects and remits tourist taxes from guests on behalf of hosts!

Is Airbnb legal in Italy?

While knowing Airbnb’s key metrics is important, it’s also a must to consider whether Airbnb is legal in the city you want to invest in. But you won’t need to worry about that, because Airbnb is legal in Italy! 

Now that you know about Airbnb’s legality in Italy, you should also check on the regulations that each region has. 

For example, to operate a short-term rental in Italy you need to complete and submit an SCIA (Segnalazione Certificata di Inizio Attività). For each Italian region, it’s also required to get permission from your city council for short-term rent in order to receive a CIR code.

Airbnb Occupancy Rates in Italy: Top 20 Profitable Italian Cities

Italy offers great investment opportunities, which is why it’s understandable that this country is attractive to property investors. But there’s still a major doubt: where to invest in real estate in Italy

To figure out the best cities to do short-term rental investments in this country, we used Airbtics’ calculator and filtered 2-bedroom properties to find out the top 20 markets with the highest occupancy rates:

1. Rome
  • Total Number of Airbnb Listings: 2,544
  • Airbnb Annual Revenue: €46,293
  • Average Daily Rate: €138
  • Occupancy Rate: 88%
  • Median Property Price (2-bedroom): €115,000
  • Gross Rental Yield: 40.25%
2. Bergamo
  • Total Number of Airbnb Listings: 49
  • Airbnb Annual Revenue: €30,994
  • Average Daily Rate: €99
  • Occupancy Rate: 88%
  • Median Property Price (2-bedroom): €135,000
  • Gross Rental Yield: 22.95%
3. Bologna
  • Total Number of Airbnb Listings: 346
  • Airbnb Annual Revenue: €38,508
  • Average Daily Rate: €129
  • Occupancy Rate: 84%
  • Median Property Price (2-bedroom): €219,000
  • Gross Rental Yield: 17.58%
4. Florence
  • Total Number of Airbnb Listings: 1,358
  • Airbnb Annual Revenue: €43,560
  • Average Daily Rate: €135
  • Occupancy Rate: 82%
  • Median Property Price (2-bedroom): €235,000 
  • Gross Rental Yield: 18.53%
5. Naples
  • Total Number of Airbnb Listings: 702
  • Airbnb Annual Revenue: €26,344
  • Average Daily Rate: €90
  • Occupancy Rate: 81%
  • Median Property Price (2-bedroom): €130,000
  • Gross Rental Yield: 20.26%
6. Milano
  • Total Number of Airbnb Listings: 1,284
  • Airbnb Annual Revenue: €43,235
  • Average Daily Rate: €163
  • Occupancy Rate: 80%
  • Median Property Price (2-bedroom): €190,000
  • Gross Rental Yield: 22.75%
7. Venice
  • Total Number of Airbnb Listings: 1,534
  • Airbnb Annual Revenue: €49,824
  • Average Daily Rate: €164
  • Occupancy Rate: 77%
  • Median Property Price (2-bedroom): €290,000
  • Gross Rental Yield: 17.18%
8. Bari
  • Total Number of Airbnb Listings: 160
  • Airbnb Annual Revenue: €30,201
  • Average Daily Rate: €106
  • Occupancy Rate: 77%
  • Median Property Price (2-bedroom): €95,000
  • Gross Rental Yield: 31.79%
9. Pisa
  • Total Number of Airbnb Listings: 122
  • Airbnb Annual Revenue: €27,567
  • Average Daily Rate: €95
  • Occupancy Rate: 77%
  • Median Property Price: €168,000
  • Gross Rental Yield: 16.40%
10. Turin
  • Total Number of Airbnb Listings: 2,398
  • Airbnb Annual Revenue: €27,575
  • Average Daily Rate: €99
  • Occupancy Rate: 76%
  • Median Property Price (2-bedroom): €79,000
  • Gross Rental Yield: 34.90%
11. Genoa
  • Total Number of Airbnb Listings: 311
  • Airbnb Annual Revenue: €26,474
  • Average Daily Rate: €92
  • Occupancy Rate: 74%
  • Median Property Price (2-bedroom): €78,000
  • Gross Rental Yield: 33.94%
12. Palermo
  • Total Number of Airbnb Listings: 688
  • Airbnb Annual Revenue: €21,581
  • Average Daily Rate: €83
  • Occupancy Rate: 71%
  • Median Property Price (2-bedroom): €70,000
  • Gross Rental Yield: 30.83%
13. Verona
  • Total Number of Airbnb Listings: 241
  • Airbnb Annual Revenue: €34,731
  • Average Daily Rate: €134
  • Occupancy Rate: 70%
  • Median Property Price (2-bedroom): €165,000
  • Gross Rental Yield: 21.04%
14. Como
  • Total Number of Airbnb Listings: 100
  • Airbnb Annual Revenue: €41,124
  • Average Daily Rate: €161
  • Occupancy Rate: 65%
  • Median Property Price (2-bedroom): €130,000
  • Gross Rental Yield: 31.63%
15. Catania
  • Total Number of Airbnb Listings: 320
  • Airbnb Annual Revenue: €18,005
  • Average Daily Rate: €73
  • Occupancy Rate: 65%
  • Median Property Price (2-bedroom): €68,000
  • Gross Rental Yield: 26.47%
16. Perugia 
  • Total Number of Airbnb Listings: 87
  • Airbnb Annual Revenue: €17,464
  • Average Daily Rate: €81
  • Occupancy Rate: 61%
  • Median Property Price (2-bedroom): €60,000
  • Gross Rental Yield: 29.10%
17. Salerno
  • Total Number of Airbnb Listings: 97
  • Airbnb Annual Revenue: €24,765
  • Average Daily Rate: €111
  • Occupancy Rate: 58%
  • Median Property Price: €130,000
  • Gross Rental Yield: 19.05%
18. Ravenna
  • Total Number of Airbnb Listings: 110
  • Airbnb Annual Revenue: €20,438
  • Average Daily Rate: €96
  • Occupancy Rate: 57%
  • Median Property Price (2-bedroom): €130,000
  • Gross Rental Yield: 15.72%
19. Syracuse
  • Total Number of Airbnb Listings: 350
  • Airbnb Annual Revenue: €18,066
  • Average Daily Rate: €88
  • Occupancy Rate: 53%
  • Median Property Price (2-bedroom): €85,000
  • Gross Rental Yield: 21.25%
20.  Matera
  • Total Number of Airbnb Listings: 80
  • Airbnb Annual Revenue: €18,781
  • Average Daily Rate: €100
  • Occupancy Rate: 53%
  • Median Property Price (2-bedroom): €108,000
  • Gross Rental Yield: 17.38%

Conclusion

In summary, Italy is not only a place of great cultural importance but it also has one of the world’s top economies and markets. On top of that, most Italian cities offer affordable housing options with attractive markets for Airbnb that can generate a nice amount of cash for investors.

There are many profitable cities in Italy, but there’s always a risk if you decide to invest in a market before analyzing all the metrics. That’s why it’s always recommended to conduct market research and analyze Airbnb data carefully for accuracy using short-term rental analytics tools.

Considering that we live in a digital era with endless possibilities and advantages that can make things easier and allow you to take the best investment decisions. Hence, we encourage you to use a short-term rental calculator to discover your market profitability!

Categories
Airbnb Occupancy All About Airbnb

Airbnb Occupancy Rates in South Korea: Best cities to invest in!

airbnb occupancy rates south korea

Investing in an Airbnb property in South Korea seems like a profitable investment if we consider that this country is a hub of economic and soft power. Besides, it is also one of the most beautiful cities in Asia that attracts a great number of visitors annually. In fact, just in 2019, the famous city of Seoul ranked 23rd among the world’s most popular cities with a total of 9.11 million tourists! 

However, before investing in a property in South Korea, it is essential to analyze which city you will be investing in and determine the profitability based on Airbnb’s important key metrics. In this article, you will find the top 20 best cities for Airbnb in South Korea along with their respective occupancy rates, monthly & yearly revenue, average daily rates (ADRs), and much more. Want to learn more? Then we recommend you to continue reading!

Why Invest in Airbnb Properties in South Korea?

airbnb occupancy rates south korea

South Korea ranks among the top 3 short-term rental markets in Asia with an average occupancy rate of 35%! This country offers people the best of both worlds: great cities with well-maintained and modern infrastructure and natural environment composed of rivers hills and mountains. 

South Korea is also home to iconic and renowned tourist attractions such as Gyeongbokgung, Seoul Tower, Bukchon Hanok Village, and much more! So both residents and visitors alike will always have something to discover in this country.

In addition to majestic tourist attractions, South Korea also offers one of the fastest internet speeds compared to other countries. Its public transportation system is among the best worldwide and health care is quite affordable. Let me add that crime rates in Korea are also really low, so while you still should be aware of your surroundings, maybe you can rest a bit more while exploring this country!

Is Airbnb legal in South Korea?

While knowing Airbnb’s key metrics is important, it’s also crucial to consider whether Airbnb is legal in the city you want to invest in. If you’re worried about Airbnb’s legality in South Korea, then do not fret anymore because it’s legal! 

The Airbnb regulations in Korea established basic rules for urban accommodation establishments for foreign tourists. This includes obtaining a VAT number from the Revenue Office, licenses, and following specific local rules. 

Yet, it’s always best to check with the local government office to know which registrations or licenses may be required for the type of experiences you will offer.

Airbnb Occupancy Rates in South Korea: The 20 Most Profitable Cities

South Korea offers excellent investment opportunities, so it’s understandable that this country is attractive to property investors. 

But there are still doubts: which city should you invest in? Should you invest in an Airbnb in modern cities like Seoul or Busan? Or better invest in an Airbnb in touristy cities like Jeju or Seogwipo? 

To figure out the best cities to do short-term rental investments in South Korea, we used Airbtics’ calculator to filter the top 20 markets with the highest occupancy rates:

1. Seongnam
  • Total Number of Airbnb Listings: 229
  • Airbnb Annual Revenue: $18,032
  • Average Daily Rate: $58
  • Occupancy Rate: 79%
  • Median Property Price: $11,996 sq.m. (15,000,000 KRW)
2. Jeju City
  • Total Number of Airbnb Listings: 5,539
  • Airbnb Annual Revenue: $19,671
  • Average Daily Rate: $83
  • Occupancy Rate: 72%
  • Median Property Price: $7,371 sq.m. (9,215,872 KRW)
3. Seoul
  • Total Number of Airbnb Listings: 7,993
  • Airbnb Annual Revenue: $11,866
  • Average Daily Rate: $51
  • Occupancy Rate: 68%
  • Median Property Price: $22,827 sq.m. (28,542,114 KRW)
4. Seogwipo
  • Total Number of Airbnb Listings: 3,562
  • Airbnb Annual Revenue: $13,952
  • Average Daily Rate: $70
  • Occupancy Rate: 58%
  • Median Property Price: $5,521 sq.m. (6,944,368 KRW)
5. Suwon
  • Total Number of Airbnb Listings: 325
  • Airbnb Annual Revenue: $8,624
  • Average Daily Rate: $46
  • Occupancy Rate: 50%
  • Median Property Price: $6,798 sq.m. (8,500,000 KRW)
6. Busan
  • Total Number of Airbnb Listings: 3,037
  • Airbnb Annual Revenue: $12,634
  • Average Daily Rate: $76
  • Occupancy Rate: 45%
  • Median Property Price: $9,324 sq.m. (11,658,852 KRW)
7. Gangneung
  • Total Number of Airbnb Listings: 1,721
  • Airbnb Annual Revenue: $16,202
  • Average Daily Rate: $97
  • Occupancy Rate: 45%
  • Median Property Price: $5,641 sq.m. (7,109,464 KRW)
8. Pyeongtaek
  • Total Number of Airbnb Listings: 119
  • Airbnb Annual Revenue: $8,282
  • Average Daily Rate: $53
  • Occupancy Rate: 42%
  • Median Property Price: $6,097 sq.m. (7,668,867 KRW)
9. Daegu
  • Total Number of Airbnb Listings: 686
  • Airbnb Annual Revenue: $7,485
  • Average Daily Rate: $47
  • Occupancy Rate: 41%
  • Median Property Price: $5,332 sq.m. (6,666,667 KRW)
10. Chungju
  • Total Number of Airbnb Listings: 59
  • Airbnb Annual Revenue: $15,722
  • Average Daily Rate: $97
  • Occupancy Rate: 41%
  • Median Property Price: $5,588 sq.m. (7,042,667 KRW)
11. Daejeon
  • Total Number of Airbnb Listings: 395
  • Airbnb Annual Revenue: $7,489
  • Average Daily Rate: $40
  • Occupancy Rate: 47%
  • Median Property Price: $2,699 sq.m. (3,375,000 KRW)
12. Gyeongju
  • Total Number of Airbnb Listings: 1,049
  • Airbnb Annual Revenue: $13,286
  • Average Daily Rate: $87
  • Occupancy Rate: 40%
  • Median Property Price: $5,735 sq.m. (7,213,540 KRW)
13. Hwaseong
  • Total Number of Airbnb Listings: 155
  • Airbnb Annual Revenue: $10,641
  • Average Daily Rate: $65
  • Occupancy Rate: 40%
  • Median Property Price: $6,584 sq.m. (8,281,420 KRW)
14. Sokcho
  • Total Number of Airbnb Listings: 956
  • Airbnb Annual Revenue: $11,957
  • Average Daily Rate: $78
  • Occupancy Rate: 38%
  • Median Property Price: $5,357 sq.m. (6,738,088 KRW)
15. Andong
  • Total Number of Airbnb Listings: 114
  • Airbnb Annual Revenue: $11,660
  • Average Daily Rate: $88
  • Occupancy Rate: 37%
  • Median Property Price: $5,505 sq.m. (6,938,061 KRW)
16. Yeosu
  • Total Number of Airbnb Listings: 941
  • Airbnb Annual Revenue: $11,575
  • Average Daily Rate: $88
  • Occupancy Rate: 33%
  • Median Property Price: $5,796 sq.m. (7,304,814 KRW)
17. Incheon
  • Total Number of Airbnb Listings: 1,363
  • Airbnb Annual Revenue: $8,645
  • Average Daily Rate: $69
  • Occupancy Rate: 32%
  • Median Property Price: $10,930 sq.m. (13,666,667 KRW)
18. Ulsan
  • Total Number of Airbnb Listings: 327
  • Airbnb Annual Revenue: $8,556
  • Average Daily Rate: $73
  • Occupancy Rate: 32%
  • Median Property Price: $14,113 sq.m. (17,743,849 KRW)
19. Tongyeong
  • Total Number of Airbnb Listings: 366
  • Airbnb Annual Revenue: $8,676
  • Average Daily Rate: $71
  • Occupancy Rate: 32%
  • Median Property Price: $5,471 sq.m. (6,895,210 KRW)
20. Jeonju
  • Total Number of Airbnb Listings: 1,283
  • Airbnb Annual Revenue: $7,350
  • Average Daily Rate: $62
  • Occupancy Rate: 31%
  • Median Property Price: $6,595 sq.m. (8,298,270 KRW)

Takeaway 

South Korea surely ranks among the top countries in many aspects. This includes being a  touristy country, a tech hub, great health care system and much more. While the real estate value is a bit higher compared to other countries, it is still a fact that it remains an attractive market to property investors since it can generate a nice amount of cash! 

There are many profitable cities in South Korea, but there’s always a risk if you decide to invest in a market before analyzing all the metrics. That’s why it’s always recommended to conduct market research for accuracy using short-term rental analytics tools. 

Luckily, you can have many advantages now as we live in a digital era that offers many resources that can greatly facilitate your work to take the best investment decisions. For this, we encourage you to use an Airbnb Income Calculator to gauge your market profitability!

Categories
Airbnb Occupancy All About Airbnb

Airbnb Data: Occupancy Rates by Zipcode

Airbnb Data: Occupancy Rates by Zipcode: Looking to get FREE and accurate Airbnb data in 2023? Check this blog and follow the 3 easy steps to get Airbnb data by zipcode!

Airbnb data by zipcode

Looking to get FREE and accurate Airbnb data in 2024? Check this blog and follow the 3 easy steps to get Airbnb data by zipcode!

Airbnb occupancy rate is one of the important metrics to gauge a property’s success. This refers to the number of days that a property is booked by guests in a particular calendar year.

If you’re looking for ways to find the best Airbnb occupancy rate by zipcode, we have it here! 

1) If you are looking to find a zipcode of your specific area, you can get that data by free from our Airbnb Analyzer app 🙂  

2) Check out the largest 100 Airbnb cities in the US in a table view here. 

3) In this article, we featured 5 states in the USA and ranked the cities with the highest and lowest occupancy rates based on accurate numbers. Continue reading to learn more!

What is Airbnb Occupancy Rate?

One of the most important performance indicators of an Airbnb property is the occupancy rate. Average Airbnb Occupancy rate vary from one place to another and are constantly changing. 

These figures are important to properly understand which markets are best for investment. According to Airbtics, the city with the highest occupancy rates in Florida is Kissimmee. With a solid 84%, you can distinguish that this city receives the most bookings. 

However, you should also consider other Airbnb Statistics such as occupancy rates, average daily rate, seasonality, property types, and amenities among others.

If you’re looking for Airbnb data by zipcode, Airbtics has this service! Check out and download the sample Airbnb data by city here. It can also be extracted in a zip code level:

Airbnb Occupancy Rates by Zipcode

Here are the highest and lowest Airbnb data by zipcodes in Florida, California, Texas, Arizona, and New York:

Airbnb data by zipcode
1. FLORIDA

Florida’s sunny weather and fascinating coastlines have definitely attracted returning tourists from across the globe. Here are the top 10 cities in Florida ranked from the highest and lowest occupancy rates with zipcodes:

airbtics-logo-300x87
City in Florida Occupancy Rate Zip codes
1. Kissimmee 84% 34741 - 34759
2. Sarasota 83% 34231 - 34249
3. Fort Lauderdale 77% 33301 - 33394
4. Jacksonville 73% 32202 - 32277
5. Tampa 71% 33602 - 33664
6. Miami 69% 33101 - 33206
7. Key West 69% 33040 - 33045
8. Naples 67% 34102 - 34120
9. Four Corners 67% 33896 - 34787
10. Orlando 54% 32801 - 32899
  • Kissimmee (34741 – 34759)
    Airbnb Occupancy Rate: 84%
    Average Daily Rate: $98
    Annual Revenue: $35,464
    Peak Season: March

  • Sarasota (34231 – 34249)
    Airbnb Occupancy Rate: 83% 
    Average Daily Rate: $187
    Annual Revenue: $65,481
    Peak Season: March

  • Fort Lauderdale (33301 – 33394)
    Airbnb Occupancy Rate: 73% 
    Average Daily Rate: $174
    Annual Revenue: $49,713
    Peak Season: March

  • Jacksonville (32202 – 32277)
    Airbnb Occupancy Rate: 73% 
    Average Daily Rate: $174
    Annual Revenue: $49,713
    Peak Season: March

  • Tampa (33602 – 33664)
    Airbnb Occupancy Rate: 71% 
    Average Daily Rate: $143
    Annual Revenue: $40,872
    Peak Season: February

  • Miami (33101 – 33206)
    Airbnb Occupancy Rate: 69% 
    Average Daily Rate: $180
    Annual Revenue: $46,314
    Peak Season: March

  • Key West (33040 – 33045)
    Airbnb Occupancy Rate: 69% 
    Average Daily Rate: $419
    Annual Revenue: $112,721
    Peak Season: March

  • Naples (34102 – 34120)
    Airbnb Occupancy Rate: 67% 
    Average Daily Rate: $255
    Annual Revenue: $70,844
    Peak Season: March

  • Four Corners (33896 – 34787)
    Airbnb Occupancy Rate: 67% 
    Average Daily Rate: $136
    Annual Revenue: $36,529
    Peak Season: July

  • Orlando (32801 – 32899)
    Airbnb Occupancy Rate: 54% 
    Average Daily Rate: $115
    Annual Revenue: $27,828
    Peak Season: February

2. CALIFORNIA

Popular as the home of actors in Hollywood, California has a large economy with several beaches and tourist destinations such as Disneyland. Here are the top 10 cities in California ranked from the highest and lowest occupancy rates with zipcodes:

airbtics-logo-300x87
City in California Occupancy Rate Zip codes
1. Santa Barbara 84% 93101 - 93190
2. Yosemite 84% 95389
3. San Francisco 80% 33301 - 33394
4. Long Beach 79% 90745 - 90899
5. Los Angeles 76% 94101 - 94188
6. San Diego 75% 34102 - 34120
7. Sacramento 62% 94203 - 94299
8. San Jose 61% 95103 - 95196
9. Palm Springs 59% 92258 - 92292
10. Fresno 30% 34231 - 34249
  • Santa Barbara (93101 – 93190)
    Airbnb Occupancy Rate: 84%
    Average Daily Rate: $269
    Annual Revenue: $91,062
    Peak Season: July

  • Yosemite (95389)
    Airbnb Occupancy Rate: 84%
    Average Daily Rate: $239
    Annual Revenue: $77,168
    Peak Season: July

  • Sacramento (94203 – 94299)
    Airbnb Occupancy Rate: 62%
    Average Daily Rate: $125
    Annual Revenue: $30,286
    Peak Season: July

  • San Jose (95103 – 95196)
    Airbnb Occupancy Rate: 61%
    Average Daily Rate: $125
    Annual Revenue: $30,286
    Peak Season: July

  • Long Beach (90745 – 90899)
    Airbnb Occupancy Rate: 79%
    Average Daily Rate: $159
    Annual Revenue: $49,431
    Peak Season: July

  • Palm Springs (92258 – 92292)
    Airbnb Occupancy Rate: 59%
    Average Daily Rate: $413
    Annual Revenue: $85,254
    Peak Season: March

  • Los Angeles (90001 – 90189)
    Airbnb Occupancy Rate: 76%
    Average Daily Rate: $148
    Annual Revenue: $41,749
    Peak Season: July

  • San Francisco (94101 – 94188)
    Airbnb Occupancy Rate: 80%
    Average Daily Rate: $144
    Annual Revenue: $44,190
    Peak Season: July

  • Fresno (93701 – 92199)
    Airbnb Occupancy Rate: 30%
    Average Daily Rate: $139
    Annual Revenue: $21,318
    Peak Season: January

  • San Diego (92101 – 34120)
    Airbnb Occupancy Rate: 75%
    Average Daily Rate: $238
    Annual Revenue: $65,904
    Peak Season: July

3. TEXAS

Known as the second largest state in America, Texas is popular for its live music, hot temperature, and distinct culture. Here are the top 10 cities in Texas ranked from the highest and lowest occupancy rates:

airbtics-logo-300x87
City in Texas Occupancy Rate Zip codes
1. Irving 74% 75014 - 75064
2. Austin 72% 78701 - 78799
3. Frisco 71% 75033 - 75036
4. Fort Worth 66% 76101 - 76199
5. Plano 62% 75023 - 75093
6. Dallas 61% 75201 - 75398
7. San Antonio 59% 78201 - 78299
8. El Paso 56% 799901 - 88595
9. Corpus Christi 48% 78401 - 78480
10. Houston 47% 77003 - 77299
  • Irving (75014 – 75064)
    Airbnb Occupancy Rate: 74%
    Average Daily Rate: $92
    Annual Revenue: $28,526
    Peak Season: July

  • Austin (78701 – 78799)
    Airbnb Occupancy Rate: 72%
    Average Daily Rate: $176
    Annual Revenue: $46,767
    Peak Season: March

  • Frisco (75033 – 75036)
    Airbnb Occupancy Rate: 71%
    Average Daily Rate: $140
    Annual Revenue: $34,267
    Peak Season: September

  • Fort Worth (76101 – 76199)
    Airbnb Occupancy Rate: 66%
    Average Daily Rate: $124
    Annual Revenue: $31,585
    Peak Season: August

  • Plano (75023 – 75093)
    Airbnb Occupancy Rate: 62%
    Average Daily Rate: $171
    Annual Revenue: $36,500
    Peak Season: July

  • Dallas (75201 – 75398)
    Airbnb Occupancy Rate: 61%
    Average Daily Rate: $127
    Annual Revenue: $30,380
    Peak Season: July

  • San Antonio (78201 – 78299)
    Airbnb Occupancy Rate: 59%
    Average Daily Rate: $134
    Annual Revenue: $30,784
    Peak Season: July

  • El Paso (799901 – 88595)
    Airbnb Occupancy Rate: 56%
    Average Daily Rate: $89
    Annual Revenue: $19,219
    Peak Season: July

  • Corpus Christi (78401 – 78480)
    Airbnb Occupancy Rate: 48%
    Average Daily Rate: $180
    Annual Revenue: $36,166
    Peak Season: July

  • Houston (77003 – 77299)
    Airbnb Occupancy Rate: 47%
    Average Daily Rate: $113
    Annual Revenue: $21,704
    Peak Season: March

4. ARIZONA

Arizona is mostly known for its iconic landmark, the Grand Canyon, and its rich history. Here are the top 10 cities in Arizona ranked from the highest and lowest occupancy rates:

airbtics-logo-300x87
City in Arizona Occupancy Rate Zip codes
1. Flagstaff 74% 86001 - 86011
2. Chandler 72% 85224 - 85249
3. Gilbert 71% 75033 - 75036
4. Yuma 71% 85364 - 85369
5. Tempe 70% 85280 - 85289
6. Scottsdale 69% 85250 - 85266
7. Tucson 68% 85701 - 85777
8. Phoenix 67% 85001 - 85099
9. Glendale 59% 85301 - 85318
10. Sedona 53% 86336 - 86351
  • Flagstaff (86001 – 86011)
    Airbnb Occupancy Rate: 80%
    Average Daily Rate: $164
    Annual Revenue: $51,232
    Peak Season: March

  • Chandler (85224 – 85249)
    Airbnb Occupancy Rate: 73%
    Average Daily Rate: $120
    Annual Revenue: $40,265
    Peak Season: March

  • Gilbert (75033 – 75036)
    Airbnb Occupancy Rate: 72%
    Average Daily Rate: $123
    Annual Revenue: $39,401
    Peak Season: March

  • Yuma (85364 – 85369)
    Airbnb Occupancy Rate: 71%
    Average Daily Rate: $156
    Annual Revenue: $39,631
    Peak Season: July

  • Tempe (85280 – 85289)
    Airbnb Occupancy Rate: 70%
    Average Daily Rate: $125
    Annual Revenue: $37,742
    Peak Season: March

  • Scottsdale (85250 – 85266)
    Airbnb Occupancy Rate: 69%
    Average Daily Rate: $142
    Annual Revenue: $44,880
    Peak Season: March

  • Tucson (85701 – 85777)
    Airbnb Occupancy Rate: 68%
    Average Daily Rate: $98
    Annual Revenue: $28,783
    Peak Season: February

  • Phoenix (85001 – 85099)
    Airbnb Occupancy Rate: 67%
    Average Daily Rate: $123
    Annual Revenue: $36,560
    Peak Season: March

  • Glendale (85301 – 85318)
    Airbnb Occupancy Rate: 59%
    Average Daily Rate: $210
    Annual Revenue: $60,513
    Peak Season: July

  • Sedona (86336 – 86351)
    Airbnb Occupancy Rate: 53%
    Average Daily Rate: $170
    Annual Revenue: $36,209
    Peak Season: March

5. NEW YORK

New York is mostly known for some of its popular tourist destinations such as Times Square, The Statue of Liberty, and Central Park among others. Here are the top 10 cities in New York ranked from the highest and lowest occupancy rates:

airbtics-logo-300x87
City in New York Occupancy Rate Zip codes
1. New York City 86% 10259
2. Brooklyn 85% 11201 - 11256
3. Buffalo 72% 14201 - 14280
4. Rochester 68% 14602 - 14694
5. Yonkers 66% 10701 - 10710
6. New Rochelle 66% 10801 - 10805
7. Syracuse 62% 13201 - 13290
8. Albany 60% 12201 - 12288
9. Cheektowaga 42% 14043 - 14215
10. Middletown 37% 10940 - 10943
  • New York City (10259)
    Airbnb Occupancy Rate: 86%
    Average Daily Rate: $170
    Annual Revenue: $52,910
    Peak Season: July

  • Brooklyn (11201 – 11256)
    Airbnb Occupancy Rate: 85%
    Average Daily Rate: $133
    Annual Revenue: $40,646
    Peak Season: July

  • Buffalo (14201 – 14280)
    Airbnb Occupancy Rate: 72%
    Average Daily Rate: $120
    Annual Revenue: $32,773
    Peak Season: July

  • Rochester (14602 – 14694)
    Airbnb Occupancy Rate: 68%
    Average Daily Rate: $126
    Annual Revenue: $32,789
    Peak Season: July

  • Yonkers (10701 – 10710)
    Airbnb Occupancy Rate: 66%
    Average Daily Rate: $99
    Annual Revenue: $22,018
    Peak Season: July

  • New Rochelle (10801 – 10805)
    Airbnb Occupancy Rate: 66%
    Average Daily Rate: $141
    Annual Revenue: $30,280
    Peak Season: July

  • Syracuse (13201 – 13290)
    Airbnb Occupancy Rate: 62%
    Average Daily Rate: $151
    Annual Revenue: $31,868
    Peak Season: August

  • Albany (85701 – 85777)
    Airbnb Occupancy Rate: 73%
    Average Daily Rate: $174
    Annual Revenue: $49,713
    Peak Season: March

  • Cheektowaga (14043 – 14215)
    Airbnb Occupancy Rate: 83%
    Average Daily Rate: $187
    Annual Revenue: $65,481
    Peak Season: March

  • Middletown(10940 – 10943)
    Airbnb Occupancy Rate: 67%
    Average Daily Rate: $255
    Annual Revenue: $70,844
    Peak Season: March

Takeaway

There are ready-made solutions by analytics company where you can just purchase a CSV file of US airbnb data by zipocde. 

If you want something free, you can sign up and use Airbnb analytics to get occupancy rate data of a specific zipcode.  

If a market has above 70% average occupancy rate, you can consider that market to be attractive place to start an Airbnb, at least, as of now. 

Airbnb investment in any city can be risky if market research is not done as the first step. 

Unlock Worldwide
Short-Term Rental Data
Find unsaturated neighborhoods with the highest occupancy history.

Categories
Airbnb Occupancy All About Airbnb

Airbnb Occupancy Rates in Digital Nomad Cities

Airbnb occupancy rates in digital nomad cities

Introduction

In the past, people used to wait for their grand retirement to have the freedom of doing anything they want in life. Particularly, traveling to their lifelong dream destinations! It’s like how the characters from the movie ‘Up’ waited for the right time to start their adventures together but..why wait until it’s too late? When the idea of being a digital nomad was formally introduced in 1997, more and more people had an extremely inspiring awakening about living the nomadic lifestyle. To sum it up, digital nomads can be described as remote workers who are traveling to their preferred destinations in the world.  When you try to think about it, it’s actually a pretty sweet deal! You get to live a work-life balance set up – have a cup of coffee by the beach or drink lemonade with a breathtaking view of the mountains while working remotely and earn $ at the same time! In this article, we featured the Airbnb occupancy rates in digital nomad cities along with the major considerations such as cost of living, internet speed, visa applications, travel expenses, and the like.

First things first: if you want to target digital nomads in the market or be one yourself, it’s important to learn about the occupancy rates by city as a start. Continue reading to figure out each city’s average cost of living, average daily rates, annual revenue, peak seasons, and the list goes on!

A-Z Listing of Major Cities

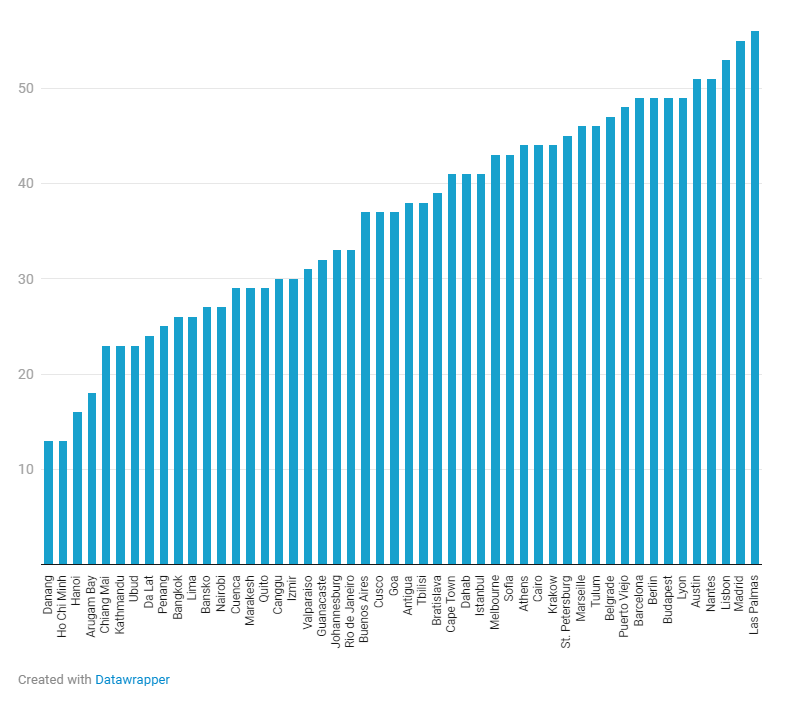
Airbnb Occupancy Rates in Digital Nomad Cities 2022

As seen on the data chart above, we have ranked each of the digital nomad cities’ respective Airbnb occupancy rates from lowest to highest in order to identify them easily. To attain accurate data presented in this article, we utilized the best Airbnb calculator and filtered 1-2 beds & baths that are suitable for a digital nomad’s room. 

Let’s dig in and check out the Airbnb data that we discovered for the top digital nomad cities in the world!

Airbnb Occupancy Rates in the Top Digital Nomad Cities

Antigua, Guatemala
Antigua, Guatemala

Antigua is a city filled with history & delivers an enjoyable and slightly adventurous Latin American experience with the unbridled nature Central America. This city is also one of the cheapest places in Central America.

  • Number of Airbnb listings: 1,058
  • Number of VRBO listings: 104
  • Average Occupancy Rate: 38% 
  • Average Nightly Rate: $88
  • Monthly Revenue: $928
  • Annual Revenue: $12,672
  • International Traveller Ratio: 92% 
  • Biggest travellers origin: USA
  • Biggest domestic travellers origin: Guatemala City
  • Most common guests language: English
  • Peak season: February – March
  • Avg. Cost of Living Per Month: $1,297
  • Internet Speed: 6mbps
  • Visa Length: No visa is required for a day of 90 days or less for most nationalities. For more information, check out Guatemalan Immigrations official website.
Arugam Bay, Sri Lanka
Arugam, Sri Lanka

Arugam Bay is a moon-shaped curl of soft sand and is home to a famed point break that many regard as the best surf spot. It’s a tiny place, with a population of a few hundred, and everything is dotted along a single road which parallels the coast.

  • Number of Airbnb listings: 202
  • Number of VRBO listings: 3
  • Average Occupancy Rate: 18% 
  • Average Nightly Rate: $58
  • Monthly Revenue: $224
  • Annual Revenue: $3,816
  • International Traveller Ratio: 50% 
  • Biggest travellers origin: Germany
  • Biggest domestic travellers origin: London
  • Most common guests language: English
  • Peak season: February 
  • Avg. Cost of Living Per Month: $620
  • Internet Speed: 9mbps (often with unstable connection)
  • Visa Length: Initially valid for 30 days ($20) and extendable to 6 months. For more information, check out Sri Lanka Immigration’s official visa page.
Athens, Greece
athens-greece

Athens is a historic city and the capital of Greece. It is bustling metropolis with plenty to see and do by day or night with plenty of coworking spaces, a growing digital nomad scene, and a generally great lifestyle. 

  • Number of Airbnb listings: 7,662
  • Number of VRBO listings: 1,396
  • Average Occupancy Rate: 44% 
  • Average Nightly Rate: $83
  • Monthly Revenue: $1,158
  • Annual Revenue: $14,172
  • International Traveller Ratio: 97% 
  • Biggest travellers origin: USA
  • Biggest domestic travellers origin: London
  • Most common guests language: English
  • Peak season: March 
  • Avg. Cost of Living Per Month: $2,888
  • Internet Speed: 13mbps (weak internet connection in most places)
  • Visa Lengt: Free Schengen visa of 90 days per 180 shared with other Schengen countries. Read for Greece’s visa conditions.
Austin, Texas
Airbnb occupancy rates in digital nomad cities

Austin is located in central Texas, at the boundary between the Texas Hill Country and the prairies of East Texas. Austin’s cost of living is a little expensive and is charming like few other places in the US.

  • Number of Airbnb listings: 7,486
  • Number of VRBO listings: 1,641
  • Average Occupancy Rate: 44% 
  • Average Nightly Rate: $270
  • Monthly Revenue: $4,207
  • Annual Revenue: $53,484
  • International Traveller Ratio: 14% 
  • Biggest travellers origin: Canada
  • Biggest domestic travellers origin: Houston
  • Most common guests language: English
  • Peak season: March 
  • Avg. Cost of Living Per Month: $4,402
  • Internet Speed: 77mbps
Bangkok, Thailand
Airbnb occupancy rates in digital nomad cities

If you’re a digital nomad but love the perks of living in a big city, then Bangkok is the right city for you. There are numerous places to explore and this city is an amazing alternative to Chiang Mai.

  • Number of Airbnb listings: 14,872
  • Number of VRBO listings: 1,196
  • Average Occupancy Rate: 26% 
  • Average Nightly Rate: $72
  • Monthly Revenue: $474
  • Annual Revenue: $7,260
  • International Traveller Ratio: 50% 
  • Biggest travellers origin: USA
  • Biggest domestic travellers origin: Bangkok
  • Most common guests language: English
  • Peak season: February
  • Avg. Cost of Living Per Month: $1,350
  • Internet Speed: 33mbps
  • Visa Length: Thailand visa: 2 Months + 1 Month Extension & 1,900 Baht Fee for $60
Bansko, Bulgaria
Airbnb occupancy rates in digital nomad cities

For nomads that prefer mountains over beaches, Bansko is a top option. In summertime, count on their being fewer nomads and expats in general, but plenty of nature, mountains, lakes, and nature parks, to enjoy cheaply.

  • Number of Airbnb listings: 758
  • Number of VRBO listings: 67
  • Average Occupancy Rate: 27% 
  • Average Nightly Rate: $68
  • Monthly Revenue: $643
  • Annual Revenue: $7,488
  • International Traveller Ratio: 86% 
  • Biggest travellers origin: UK
  • Biggest domestic travellers origin: Sofia
  • Most common guests language: English
  • Peak season: February – March
  • Avg. Cost of Living Per Month: $1,428
  • Internet Speed: 30mbps
  • Visa Length: Up to 90 days every 180 days. Bulgaria is an EU country but is not in the Schengen zone. See Bulgaria Visa Information for your reference.
Barcelona, Spain
Airbnb occupancy rates in digital nomad cities

The city of Barcelona has countless coworking spaces, cafes with strong wifi and generally has a never ending nightlife. In addition to this, the cost of living is extremely low and there are numerous accommodations available

  • Number of Airbnb listings: 11,334
  • Number of VRBO listings: 1,844
  • Average Occupancy Rate: 49% 
  • Average Nightly Rate: $156
  • Monthly Revenue: $2,486
  • Annual Revenue: $29,772
    International Traveller Ratio: 85% 
  • Biggest travellers origin: USA
  • Biggest domestic travellers origin: Paris
  • Most common guests language: English
  • Peak season: September – October
  • Avg. Cost of Living Per Month: $1,350
  • Internet Speed: 33mbps
  • Visa Length: Free Schengen visa of 90 days per 180 days (shared with other Schengen countries). For your reference, see Schengen visa info.
Berlin, Germany
Berlin

Berlin is a diverse city filled with history and culture. As the capital city of Germany, Berlin is renowned for its exceptional range of landmarks, vibrant cultural scene and way of life that’s somehow all go yet relaxed.

  • Number of Airbnb listings: 7,134
  • Number of VRBO listings: 543
  • Average Occupancy Rate: 49% 
  • Average Nightly Rate: $135
  • Monthly Revenue: $2,196
  • Annual Revenue: $25,584
  • International Traveller Ratio: 75% 
  • Biggest travellers origin: USA
  • Biggest domestic travellers origin: New York City
  • Most common guests language: English
  • Peak season: August – September
  • Avg. Cost of Living Per Month: $3,000
  • Internet Speed: 23mbps
  • Visa Length: Up to 90 days, then you have to apply for a Schengen short-stay visa to Germany (C-type visa). For more information, visit Germany visa information.
Belgrade, Serbia
Airbnb occupancy rates in digital nomad cities

Belgrade has all types of architecture, from Ottoman to Austro Hungarian, Art Nouveau, and contemporary architecture. The majority of nomads in Belgrade noted that this city offers a western European lifestyle on an Eastern European budget.

  • Number of Airbnb listings: 1,949
  • Number of VRBO listings: 196
  • Average Occupancy Rate: 47% 
  • Average Nightly Rate: $91
  • Monthly Revenue: $1,456
  • Annual Revenue: $16,032
  • International Traveller Ratio: 83% 
  • Biggest travellers origin: USA
  • Biggest domestic travellers origin: Belgrade
  • Most common guests language: English
  • Peak season: July – August 
  • Avg. Cost of Living Per Month: $1,537
  • Internet Speed: 34mbps
  • Visa Length: Serbia is not part of the Schengen zone and offers a free 90-day visa for most visitors
Bratislava, Slovakia
Airbnb occupancy rates in digital nomad cities

Another popular European digital nomad location is the city of Bratislava in Slovakia. This city has fast 32 Mbps internet and a moderate climate, which makes it easy to live and work here on the road. 

  • Number of Airbnb listings: 842
  • Number of VRBO listings: 49
  • Average Occupancy Rate: 39% 
  • Average Nightly Rate: $83
  • Monthly Revenue: $875
  • Annual Revenue: $12,432
  • International Traveller Ratio: 86% 
  • Biggest travellers origin: UK
  • Biggest domestic travellers origin: Bratislava
  • Most common guests language: English
  • Peak season: August – September
  • Avg. Cost of Living Per Month: $1,252
  • Internet Speed: 32mbps
  • Visa Length: Up to 90 days. For detailed instructions, visit Slovakia visa information
Budapest, Hungary
Airbnb occupancy rates in digital nomad cities

Budapest is famous for its rich culture, underground caves, the mighty Danube River, and for being the Spa Capital of the World. Nomads have dubbed Budapest as “the Bangkok of Eastern Europe” for positive and negative reasons. Though this city is fantastic, the locals and can be somewhat closed and closed off to foreigners.

  • Number of Airbnb listings: 5,544
  • Number of VRBO listings: 565
  • Average Occupancy Rate: 49% 
  • Average Nightly Rate: $102
  • Monthly Revenue: $1,351
  • Annual Revenue: $19,320
  • International Traveller Ratio: 94% 
  • Biggest travellers origin: UK
  • Biggest domestic travellers origin: London
  • Most common guests language: English
  • Peak season: November – December
  • Avg. Cost of Living Per Month: $1,542
  • Internet Speed: 38mbps
  • Visa Length: Free Schengen visa of 90 days per 180 days (shared with other Schengen countries). Check out Hungary’s visa policy for your reference.
Buenos Aires, Argentina
Airbnb occupancy rates in digital nomad cities

Buenos Aires has good metro system that allows you to get anywhere in this huge city cheaply and easily across this amazing city. The majority of digital nomads in this city noted an extremely low cost of living.

  • Number of Airbnb listings: 15,679
  • Number of VRBO listings: 855
  • Average Occupancy Rate: 37% 
  • Average Nightly Rate: $63
  • Monthly Revenue: $747
  • Annual Revenue: $9,168
  • International Traveller Ratio: 88% 
  • Biggest travellers origin: Brazil
  • Biggest domestic travellers origin: Buenos Aires
  • Most common guests language: Spanish
  • Peak season: February – March 
  • Avg. Cost of Living Per Month: $733
  • Internet Speed: 23mbps
  • Visa Length: 3 months according to Argentina visa
Cairo, Egypt
Airbnb occupancy rates in digital nomad cities

If you are a digital nomad seeking for convenience, comfort, and a fast wifi connection, Cairo might not be an ideal city for you. Although this city is rich in history and ancient artifacts, some of the downsides here include traffic & pollution.

  • Number of Airbnb listings: 308
  • Number of VRBO listings: 18
  • Average Occupancy Rate: 44% 
  • Average Nightly Rate: $54
  • Monthly Revenue: $889
  • Annual Revenue: $9,384
  • International Traveller Ratio: 90% 
  • Biggest travellers origin: USA
  • Biggest domestic travellers origin: New York City
  • Most common guests language: English
  • Peak season: May
  • Avg. Cost of Living Per Month: $853
  • Internet Speed: 6mbps
  • Visa Length: 180 days based on Egypt Visa information
Canggu, Indonesia
Airbnb occupancy rates in digital nomad cities

The city of Canggu is ideal for digital nomads who would like to work as much as they want to be by the sea & explore surfing. It has plenty of co-working spaces, cafes, and a community of digital nomads.

  • Number of Airbnb listings: 2,806
  • Number of VRBO listings: 906
  • Average Occupancy Rate: 30% 
  • Average Nightly Rate: $102
  • Monthly Revenue: $909
  • Annual Revenue: $11,532
  • International Traveller Ratio: 50% 
  • Biggest travellers origin: USA
  • Biggest domestic travellers origin: Jakarta
  • Most common guests language: English
  • Peak season: November – December
  • Avg. Cost of Living Per Month: $1,103
  • Internet Speed: 21mbps
  • Visa Length: 30 days for a single entry according to Indonesian visa policies
Cape Town, South Africa
Airbnb occupancy rates in digital nomad cities

Cape Town is one of the best locations for digital nomads in Africa. Not to mention its countless coffee shops and coworking spaces, this city offers a cheap cost of living.

  • Number of Airbnb listings: 10,805
  • Number of VRBO listings:1,220
  • Average Occupancy Rate: 41% 
  • Average Nightly Rate: $114
  • Monthly Revenue: $1,495
  • Annual Revenue: $17,832
  • International Traveller Ratio: 92% 
  • Biggest travellers origin: Germany
  • Biggest domestic travellers origin: Cape Town
  • Most common guests language: English
  • Peak season: November – January
  • Avg. Cost of Living Per Month: $1,738
  • Internet Speed: 9mbps
  • Visa Length: 90 days according to South Africa’s visitor visa
Chiang Mai, Thailand
Airbnb occupancy rates in digital nomad cities

Chiang Mai is a remarkable city among the digital nomad community because of its affordability and good quality of life. It’s easy to get around, has excellent wi-fi, cheap, and plenty of co-working spaces for nomads.

  • Number of Airbnb listings: 5,429
  • Number of VRBO listings: 373
  • Average Occupancy Rate: 23% 
  • Average Nightly Rate: $64
  • Monthly Revenue: $378
  • Annual Revenue: $5,796
  • International Traveller Ratio: 50% 
  • Biggest travellers origin: USA
  • Biggest domestic travellers origin: Bangkok
  • Most common guests language: English
  • Peak season: February – March
  • Avg. Cost of Living Per Month: $989
  • Internet Speed: 30 Mbps
  • Visa Length: 2 Months + 1 Month Extension | 1,900 Baht Fee for $60. For more information, see Thailand’s visa policies.
Cusco, Peru
Cusco

This city is suitable for nomads who are looking for an adventure more than stability. Cusco will give you an exquisite nomadic lifestyle as it offers numerous exciting outdoor activities.

  • Number of Airbnb listings: 1,946
  • Number of VRBO listings: 96
  • Average Occupancy Rate: 37% 
  • Average Nightly Rate: $37
  • Monthly Revenue: $390
  • Annual Revenue: $5,328
  • International Traveller Ratio: 90% 
  • Biggest travellers origin: USA
  • Biggest domestic travellers origin: New York City
  • Most common guests language: English
  • Peak season: August
  • Avg. Cost of Living Per Month: $1,144
  • Internet Speed: 11mbps
  • Visa Length: 6 months according to Peru visa
Cuenca, Ecuador
Cuenca

This UNESCO World Heritage-listed city is a joy to explore and offers many opportunities to learn more about Andean culture. You can also spend your work breaks napping along the Rio Tomebamba riverfront or visit one of the local museums. 

  • Number of Airbnb listings: 1,028
  • Number of VRBO listings: 52
  • Average Occupancy Rate: 29% 
  • Average Nightly Rate: $47
  • Monthly Revenue: $404
  • Annual Revenue: $5,304
  • International Traveller Ratio: 67% 
  • Biggest travellers origin: USA
  • Biggest domestic travellers origin: Guayaquil
  • Most common guests language: English
  • Peak season: December
  • Avg. Cost of Living Per Month: $874
  • Internet Speed: 16mbps
  • Visa Length: 90 days according to Ecuador visa
Da Lat, Vietnam
Da Lat

The city of Da Lat is a quiet place to work since there aren’t a lot of nightlife and tourists. If you are looking for a low cost of living in Vietnam, Da Lat may be a good place to enjoy a Vietnamese nomadic travel experience.

  • Number of Airbnb listings: 478
  • Number of VRBO listings: 13
  • Average Occupancy Rate: 24% 
  • Average Nightly Rate: $53
  • Monthly Revenue: $381
  • Annual Revenue: $4,776
  • International Traveller Ratio: 24% 
  • Biggest travellers origin: USA
  • Biggest domestic travellers origin: Ho Chi Minh City
  • Most common guests language: English
  • Peak season: August
  • Avg. Cost of Living Per Month: $978
  • Internet Speed: 13mbps
  • Visa Length: 1 Year (Us Citizens) Or 3 Months Multi-Entry + 3 Month Extension | $135 Fee. Check out Vietnamese tourist visas for more information.
Danang, Vietnam
Airbnb occupancy rates in digital nomad cities

Danang is a beautiful city with plenty of co-working spaces where digital nomads can increase productiveness. However, the social scene for foreigners is noted for being a little difficult in comparison to other Asian cities. 

  • Number of Airbnb listings: 3,468
  • Number of VRBO listings: 317
  • Average Occupancy Rate: 13% 
  • Average Nightly Rate: $54
  • Monthly Revenue: $225
  • Annual Revenue: $2,664
  • International Traveller Ratio: 50% 
  • Biggest travellers origin: USA
  • Biggest domestic travellers origin: Seoul
  • Most common guests language: English
  • Peak season: May
  • Avg. Cost of Living Per Month: $1,026
  • Internet Speed: 14mbps
  • Visa Length: 1 Year (Us Citizens) Or 3 Months Multi-Entry + 3 Months Extension. Check out the validity of Vietnamese visas for more information.
Dahab, Egypt
Airbnb occupancy rates in digital nomad cities

Dahab is a city in Egypt that is known for its warm weather and is the cheapest yet safest location for digital nomads in the Middle East & North Africa. On the other hand, one of the city’s downsides is not having an extremely strong wifi connection or cell signal.

  • Number of Airbnb listings: 577
  • Number of VRBO listings: 14
  • Average Occupancy Rate: 41% 
  • Average Nightly Rate: $80
  • Monthly Revenue: $824
  • Annual Revenue: $12,552
  • International Traveller Ratio: 88% 
  • Biggest travellers origin: USA
  • Biggest domestic travellers origin: Cairo
  • Most common guests language: English
  • Peak season: November
  • Avg. Cost of Living Per Month: $1,019
  • Internet Speed: 9mbps
  • Visa Length: 6 months
Goa, India
Goai

Goa is one of India’s southern states and is famous for its beaches and places of worship. The city’s tourism is its primary industry, and is generally focused on the coastal areas of Goa, with decreased tourist activity inland.

  • Number of Airbnb listings: 4,191
  • Number of VRBO listings: 268
  • Average Occupancy Rate: 37% 
  • Average Nightly Rate: $61
  • Monthly Revenue: $671
  • Annual Revenue: $8,532
  • International Traveller Ratio: 40% 
  • Biggest travellers origin: USA
  • Biggest domestic travellers origin: Mumbai
  • Most common guests language: English
  • Peak season: November – December
  • Avg. Cost of Living Per Month: $1,369
  • Internet Speed: 10mbps
  • Visa Lengthe: Tourist e-Visa valid for 30 days, 1 year, or 5 years according to Indian e-Visa
Guanacaste, Costa Rica
Guanacaste

This nomad city offers tropical weather & a breathtaking view of the Carribean sea. On the other hand, Guanacaste was noted with slower internet speeds and expensive rent costs.

  • Number of Airbnb listings: 88
  • Number of VRBO listings: 3
  • Average Occupancy Rate: 32% 
  • Average Nightly Rate: $89
  • Monthly Revenue: $909
  • Annual Revenue: $10,668
  • International Traveller Ratio: 75
  • Biggest traveller’s origin: USA
  • Biggest domestic traveller’s origin: San José
  • Most common guests language: English
  • Peak season: February
  • Avg. Cost of Living Per Month: $2,000
  • Internet Speed: 3.9 – 7mbps
  • Visa Length: 90 days according to Costa Rica’s visa information
Hanoi, Vietnam
Hanoi

Hanoi is a beautiful Vietnamese city with plenty of nomadic infrastructures that you can enjoy. Filled with accessible local cafes, this city offers a unique architecture because of its French influence.

  • Number of Airbnb listings: 5,987
  • Number of VRBO listings: 377
  • Average Occupancy Rate: 16% 
  • Average Nightly Rate: $87
  • Monthly Revenue: $203
  • Annual Revenue: $5,256
  • International Traveller Ratio: 50
  • Biggest traveller’s origin: USA
  • Biggest domestic traveller’s origin: Hanoi
  • Most common guests language: English
  • Peak season: March
  • Avg. Cost of Living Per Month: $960
  • Internet Speed: 16mbps
  • Visa Length: 1 Year (Us Citizens) or 3 Months Multi-Entry + 3 Month Extension
Ho Chi Minh City, Vietnam
Airbnb occupancy rates in digital nomad cities

Ho Chi Minh is considered as one of Southeast Asia’s digital nomad-friendly cities and is ideal for those who are hustling with a limited budget. 

  • Number of Airbnb listings: 285
  • Number of VRBO listings: 25
  • Average Occupancy Rate: 13% 
  • Average Nightly Rate: $38
  • Monthly Revenue: $178
  • Annual Revenue: $1,944
  • International Traveller Ratio: 50
  • Biggest traveller’s origin: USA
  • Biggest domestic traveller’s origin: Hanoi
  • Most common guests language: English
  • Peak season: April
  • Avg. Cost of Living Per Month: $961
  • Internet Speed: 13mbps
  • Visa Length:1 Year (Us Citizens) Or 3 Months Multi-Entry + 3 Months Extension
Istanbul, Turkey
Istanbul

Istanbul is an ideal city for nomads who are looking for a historical experience with accessible transportation in a big city. The cost of living & food expenses are remarkably cheap too! 

  • Number of Airbnb listings: 17,056
  • Number of VRBO listings: 651
  • Average Occupancy Rate: 41% 
  • Average Nightly Rate: $78
  • Monthly Revenue: $905
  • Annual Revenue: $12,348
  • International Traveller Ratio: 88
  • Biggest traveller’s origin: USA
  • Biggest domestic traveller’s origin: Istanbul
  • Most common guests language: English
  • Peak season: February – March
  • Avg. Cost of Living Per Month: $1,067
  • Internet Speed: 12mbps
  • Visa Length: 90-day multiple-entry based on Turkey’s e-Visa
Izmir, Turkey
Izmir

Izmir is a budget-friendly city that offers a rich culture and a quality living experience. However, it can be extremely hot during the summertime in this city.

  • Number of Airbnb listings: 4,073
  • Number of VRBO listings: 110
  • Average Occupancy Rate: 30% 
  • Average Nightly Rate: $75
  • Monthly Revenue: $620
  • Annual Revenue: $8,784
  • International Traveller Ratio: 89
  • Biggest traveller’s origin: USA
  • Biggest domestic traveller’s origin: Istanbul
  • Most common guests language: English
  • Peak season: July – August
  • Avg. Cost of Living Per Month: $685
  • Internet Speed: 19mbps
  • Visa Length: 90-day multiple-entry based on Turkey’s e-Visa
Johannesburg, South Africa
Airbnb occupancy rates in digital nomad cities

In this city, you can find charming restaurants & coffee shops that are suitable for a unique digital nomad experience. Although internet speed may be a primary concern for most cities in Africa, there are plenty of remote workers who are staying in Johannesburg because of the good quality of life & low cost of living.

  • Number of Airbnb listings: 2,119
  • Number of VRBO listings: 85
  • Average Occupancy Rate: 33% 
  • Average Nightly Rate: $84
  • Monthly Revenue: $786
  • Annual Revenue: $10,596
  • International Traveller Ratio: 67
  • Biggest traveller’s origin: USA
  • Biggest domestic traveller’s origin: Cape Town
  • Most common guests language: English
  • Peak season: June
  • Avg. Cost of Living Per Month: $1,961
  • Internet Speed: 12mbps
  • Visa Length: 90 days according to South Africa’s visitor visa
Krakow, Poland
Krakow

Krakow is undeniably one of the cheapest locations for digital nomads who prefer to try visiting Europe! Because it offers the lowest cost of living in Europe, a handful of digital nomads stay in most cafes and co-working spaces with excellent internet speed.

  • Number of Airbnb listings: 4,385
  • Number of VRBO listings: 506
  • Average Occupancy Rate: 44% 
  • Average Nightly Rate: $76
  • Monthly Revenue: $954
  • Annual Revenue: $12,984
  • International Traveller Ratio: 88
  • Biggest traveller’s origin: USA
  • Biggest domestic traveller’s origin: London
  • Most common guests language: English
  • Peak season: August
  • Avg. Cost of Living Per Month: $1,574
  • Internet Speed: 43mbps
  • Visa Length: Up to 90 days, then you have to apply for a Schengen short-term visa. For more information, visit Poland visa information 
Kathmandu, Nepal
Airbnb occupancy rates in digital nomad cities

If you’re looking forward to working near the Himalayas & Everest, this is the right city for an adventurous digital nomad like you! With its relatively cheap cost of living and average internet speed, Kathmandu is a must-place city for the majority of outdoor enthusiasts.

  • Number of Airbnb listings: 1,885
  • Number of VRBO listings:65
  • Average Occupancy Rate: 23% 
  • Average Nightly Rate: $49
  • Monthly Revenue: $290
  • Annual Revenue: $4,344
  • International Traveller Ratio: 96
  • Biggest traveller’s origin: USA
  • Biggest domestic traveller’s origin: London
  • Most common guests language: English
  • Peak season: March
  • Avg. Cost of Living Per Month: $609
  • Internet Speed: 8mbps
  • Visa Length: 15 Days (30 USD), 30 Days (50 USD), and 90 Days (125 USD) visas on arrival available at Tribhuvan International Airport on arrival for most nationalities. Learn more information about Nepal’s visas.
Lisbon, Portugal
Airbnb occupancy rates in digital nomad cities

Lisbon is a small city that offers a unique vibe and a suitable working environment for any digital nomad. Because of its diverse environment, this city is inviting to various nomads who want to connect with others & explore a high quality of life. 

  • Number of Airbnb listings: 10,061
  • Number of VRBO listings: 2,274
  • Average Occupancy Rate: 53% 
  • Average Nightly Rate: $114
  • Monthly Revenue: $1,865
  • Annual Revenue: $23,220
  • International Traveller Ratio: 93
  • Biggest traveller’s origin: USA
  • Biggest domestic traveller’s origin: Paris
  • Most common guests language: English
  • Peak season: October
  • Avg. Cost of Living Per Month: $2,033
  • Internet Speed: 26mbps
  • Visa Length: Up to 90 days, then you have to apply for a Schengen short-term visa. For more information, visit Portugal visa information
Lima, Peru
Airbnb occupancy rates in digital nomad cities

This city is an ideal option for digital nomads who prefer to be in a rich & urban city with plenty of nightlife options and art exhibits. 

  • Number of Airbnb listings: 515
  • Number of VRBO listings: 14
  • Average Occupancy Rate: 26% 
  • Average Nightly Rate: $32
  • Monthly Revenue: $248
  • Annual Revenue: $3,432
  • International Traveller Ratio: 57
  • Biggest traveller’s origin: USA
  • Biggest domestic traveller’s origin: Lima
  • Most common guests language: Spanish
  • Peak season: February – March
  • Avg. Cost of Living Per Month: $942
  • Internet Speed: 14mbps
  • Visa Length: 6 months according to Peru visa
Lyon, France
Lyon

Lyon is a French city where the majority of travelers haven’t taken over yet – therefore having an exclusive vibe for nomads. However, you might need to speak their romantic language in order to have social engagements with locals. 

  • Number of Airbnb listings: 1,111
  • Number of VRBO listings: 101
  • Average Occupancy Rate: 49% 
  • Average Nightly Rate: $128
  • Monthly Revenue: $1,889
  • Annual Revenue: $24,192
  • International Traveller Ratio: 50
  • Biggest traveller’s origin: USA
  • Biggest domestic traveller’s origin: Paris
  • Most common guests language: French
  • Peak season: September
  • Avg. Cost of Living Per Month: $3,079
  • Internet Speed: 26mbps
  • Visa Length: Up to 90 days, then you have to apply for a Schengen short-term visa. For more information, see how to get a visa in France
Las Palmas, Spain
Las Palmas

Behold, the digital nomad city with the highest occupancy rate! Ranked as the first city because of its overall excellence, Las Palmas is the capital of Gran Canaria where the majority of digital nomads travel to.

  • Number of Airbnb listings: 1,417
  • Number of VRBO listings: 415
  • Average Occupancy Rate: 56% 
  • Average Nightly Rate: $99
  • Monthly Revenue: $1,825
  • Annual Revenue: $21,312
  • International Traveller Ratio: 94
  • Biggest traveller’s origin: Germany
  • Biggest domestic traveller’s origin: Madrid
  • Most common guests language: English
  • Peak season: November – December
  • Avg. Cost of Living Per Month: $1,284
  • Internet Speed: 79mbps
  • Visa Length: Free Schengen visa of 90 days per 180 days (shared with other Schengen countries). For your reference, see how to get a visa in Spain
Madrid, Spain
Airbnb occupancy rates in digital nomad cities

Madrid generally has everything you need in a nomadic city – from chic workspaces, reliable internet connection, to amazing nightlife & restaurants, this city has it all. 

  • Number of Airbnb listings: 7,041
  • Number of VRBO listings: 1,060
  • Average Occupancy Rate: 55% 
  • Average Nightly Rate: $149
  • Monthly Revenue: $2,496
  • Annual Revenue: $31,680
  • International Traveller Ratio: 90
  • Biggest traveller’s origin: USA
  • Biggest domestic traveller’s origin: Madrid
  • Most common guests language: Spanish
  • Peak season: September – December
  • Avg. Cost of Living Per Month: $2,845
  • Internet Speed: 34mbps
  • Visa Length: Free Schengen visa of 90 days per 180 days (shared with other Schengen countries). For your reference, check out Spain visa requirements
Marseille, France
Airbnb occupancy rates in digital nomad cities

There’s no denying that this French city offers numerous coastal establishments with exquisite European charm, however, Marseille has limited co-working spaces with wi-fi. Although this may not be an ideal workplace for nomads, it’s definitely worth exploring this French city during work breaks!

  • Number of Airbnb listings: 4,691
  • Number of VRBO listings: 587
  • Average Occupancy Rate: 46% 
  • Average Nightly Rate: $107
  • Monthly Revenue: $1,593
  • Annual Revenue: $19,152
  • International Traveller Ratio: 75
  • Biggest traveller’s origin: Germany
  • Biggest domestic traveller’s origin: Paris
  • Most common guests language: French
  • Peak season: August
  • Avg. Cost of Living Per Month: $3,229
  • Internet Speed: 27mbps
  • Visa Length: Up to 90 days, then you have to apply for a Schengen short-term visa. For more information, see France visa requirements
Marrakesh, Morocco
Airbnb occupancy rates in digital nomad cities

Morocco’s old architecture & low cost of living is a perfect combination for digital nomads who have old souls. On a side note, alcohol is controlled in this city, which might not be suitable for those who are expecting to unwind with tequila after a long day’s work.

  • Number of Airbnb listings: 4,114
  • Number of VRBO listings: 346
  • Average Occupancy Rate: 29% 
  • Average Nightly Rate: $70
  • Monthly Revenue: $594
  • Annual Revenue: $7,932
  • International Traveller Ratio: 75
  • Biggest traveller’s origin: France
  • Biggest domestic traveller’s origin: London
  • Most common guests language: English
  • Peak season: February – March
  • Avg. Cost of Living Per Month: $1,906
  • Internet Speed: 8mbps
  • Visa Length: 90-day single or multiple entries based on the Moroccan Ministry of Foreign Affairs
Melbourne, Australia
Airbnb occupancy rates in digital nomad cities

Known as Australia’s second-largest city, Melbourne is popular for its cafes & co-working spaces with an excellent internet speed. The city’s great public transport is also an important factor to take note for digital nomads who are looking forward to exploring the city.

  • Number of Airbnb listings: 13,871
  • Number of VRBO listings: 4,142
  • Average Occupancy Rate: 43% 
  • Average Nightly Rate: $157
  • Monthly Revenue: $2,227
  • Annual Revenue: $26,856
  • International Traveller Ratio: 23
  • Biggest traveller’s origin: UK
  • Biggest domestic traveller’s origin: Melbourne
  • Most common guests language: English
  • Peak season: December – March
  •  Cost of living per month: $3,200
  •  Internet speed: 50mbps
  • Visa Length: 3 months according to Australia visa requirements
Nairobi, Kenya
Airbnb occupancy rates in digital nomad cities

If you are a unique digital nomad who wants to experience the nature & wildlife, Nairobi is the city for you! This city is also the economic & tech hub of East Africa, which makes it accessible for most remote workers & entrepreneurs. 

  • Number of Airbnb listings: 7,745
  • Number of VRBO listings: 506
  • Average Occupancy Rate: 27% 
  • Average Nightly Rate: $57
  • Monthly Revenue: $485
  • Annual Revenue: $6,000
  • International Traveller Ratio: 92
  • Biggest traveller’s origin: USA
  • Biggest domestic traveller’s origin: Nairobi
  • Most common guests language: English
  • Peak season: August
  • Avg. Cost of Living Per Month: $1,228
  • Internet Speed: 9mbps
  • Visa Length: 90 days as seen on Kenya visa requirements
Nantes, France
Airbnb occupancy rates in digital nomad cities

Nantes is for digital nomads who are willing to pay the price for a wonderful European experience. Similar to Marseille, this city will require you to speak French for the most part to attain a complete nomadic experience.

  • Number of Airbnb listings: 1,307
  • Number of VRBO listings: 87
  • Average Occupancy Rate: 51% 
  • Average Nightly Rate: $92
  • Monthly Revenue: $1,509
  • Annual Revenue: $18,204
  • International Traveller Ratio: 8
  • Biggest traveller’s origin: UK
  • Biggest domestic traveller’s origin: Paris
  • Most common guests language: French
  • Peak season: September
  • Avg. Cost of Living Per Month: $4,437
  • Internet Speed: 42mbps
  • Visa Length: Up to 90 days, then you have to apply for a Schengen short-term visa. For more information, see France visa policies 
Penang, Malaysia
Airbnb occupancy rates in digital nomad cities

Penang’s laid-back city-island offers an interesting culture to most digital nomads and vacationers. Aside from accessible coworking spaces with a strong internet connection, this city offers various cuisine & is relatively clean! 

  • Number of Airbnb listings: 1,442
  • Number of VRBO listings: 114
  • Average Occupancy Rate: 25% 
  • Average Nightly Rate: $74
  • Monthly Revenue: $582
  • Annual Revenue: $7,320
  • International Traveller Ratio:33
  • Biggest traveller’s origin: USA
  • Biggest domestic traveller’s origin: Kuala Lumpur
  • Most common guests language: English
  • Peak season: December
  • Avg. Cost of Living Per Month: $1,085
  • Internet Speed: 19mbps
  • Visa Length: 3-12 months based on Malaysia visa requirements
Puerto Viejo, Costa Rica
Puerto Viejo

If you imagine yourself in a coastal village without having to use the fake sea background during virtual meetings, this is the right city for you! Puerto Viejo offers an Afro-Carribean charm with the best nightlife too. 

  • Number of Airbnb listings: 449
  • Number of VRBO listings: 54
  • Average Occupancy Rate: 48% 
  • Average Nightly Rate: $103
  • Monthly Revenue: $1,640
  • Annual Revenue: $19,080
  • International Traveller Ratio: 92% 
  • Biggest traveller’s origin: USA
  • Biggest domestic traveller’s origin: San José
  • Most common guests language: English
  • Peak season: March
  • Avg. Cost of Living Per Month: $2,380
  • Internet Speed: 9mbps
  • Visa Length: 90 days! Learn more on how to get a visa in Costa Rica
Quito, Ecuador
Quito

If you are a digital nomad who loves to be around nature, Quito is the most recommended city for you. Offering a low cost of living, this city is nearby hot springs, mountains, and volcanoes that you can definitely explore!

  • Number of Airbnb listings: 6,182
  • Number of VRBO listings: 188
  • Average Occupancy Rate: 29% 
  • Average Nightly Rate: $46
  • Monthly Revenue: $391
  • Annual Revenue: $5,316
  • International Traveller Ratio: 86% 
  • Biggest traveller’s origin: USA
  • Biggest domestic traveller’s origin: Quito
  • Most common guests language: Spanish
  • Peak season: February – March
  • Avg. Cost of Living Per Month: $989
  • Internet Speed: 10mbps
  • Visa Length: 90 days according to Ecuador visa requirements
Rio De Janeiro, Brazil
Rio de Janeiro

Do you want to work with a view of both the mountains & the sea? If yes, then Rio is the place to be! You can enjoy activities from the Carnaval, dance to samba music, or simply be one of the locals who know how to live a work-life balance setup.

  • Number of Airbnb listings: 1,334
  • Number of VRBO listings: 74
  • Average Occupancy Rate: 33% 
  • Average Nightly Rate: $98
  • Monthly Revenue: $598
  • Annual Revenue: $12,564
  • International Traveller Ratio: 42% 
  • Biggest traveller’s origin: France
  • Biggest domestic traveller’s origin: Rio de Janeiro
  • Most common guests language: Portuguese
  • Peak season: February – March
  • Avg. Cost of Living Per Month: $1,500
  • Internet Speed: 25mbps
  • Visa Length: 90 days according to Brazil visa requirements
Sofia, Bulgaria
Sofia

This city in Bulgaria offers a low cost of living & good quality of life for the majority of nomads. Since the locals in Sofia are extreme foodies, you can definitely see various cuisines that are tasty!

  • Number of Airbnb listings: 1,611
  • Number of VRBO listings: 254
  • Average Occupancy Rate: 43% 
  • Average Nightly Rate: $54
  • Monthly Revenue: $712
  • Annual Revenue: $9,072
  • International Traveller Ratio: 75% 
  • Biggest traveller’s origin: UK
  • Biggest domestic traveller’s origin: Sofia
  • Most common guests language: English
  • Peak season: July
  • Avg. Cost of Living Per Month: $1,401
  • Internet Speed: 27mbps
  • Visa Length: Up to 90 days every 180 days. Bulgaria is an EU country but is not in the Schengen zone. See how to get a visa in Bulgaria for your reference
St. Petersburg, Russia
Airbnb occupancy rates in digital nomad cities

St. Petersburg is filled with co-working spaces with accessible public transportation. On a side note, if you would like to stay here for more than a year, you have to consider that it could get disastrous during the winter season.

  • Number of Airbnb listings: 6,780
  • Number of VRBO listings: 270
  • Average Occupancy Rate: 45% 
  • Average Nightly Rate: $66
  • Monthly Revenue: $864
  • Annual Revenue: $11,232
  • International Traveller Ratio: 33% 
  • Biggest traveller’s origin: USA
  • Biggest domestic traveller’s origin: Moscow
  • Most common guests language: Russian
  • Peak season: June
  • Avg. Cost of Living Per Month: $1,628
  • Internet Speed: 15mbps
  • Visa Length: 30 days | 3 years for US citizens according to Russian visas validity
Tulum, Mexico
Tulum MX

Tulum is considered as the “Bali of Mexico” – and because of this, the city has been jampacked with tourists from all over the world. Because the place has become more and more popular for digital nomads, the locals mentioned that they are continuously working on improving their internet speed & cell signal.

  • Number of Airbnb listings: 6,919
  • Number of VRBO listings: 876
  • Average Occupancy Rate: 46% 
  • Average Nightly Rate: $136
  • Monthly Revenue: $2,039
  • Annual Revenue: $23,856
  • International Traveller Ratio: 98% 
  • Biggest traveller’s origin: USA
  • Biggest domestic traveller’s origin: New York City 
  • Most common guests language: English
  • Peak season: February – March
  • Avg. Cost of Living Per Month: $2,167
  • Internet Speed: 13mbps
  • Visa Length: Mexico: 30 – 90 days according to Mexico visa requirements
Tbilisi, Georgia
Airbnb occupancy rates in digital nomad cities

Close to the mountains, wineries, vineyards, and beaches, this city is known for its mixture of cultures, cheap cost of living, and nomadic communities. 

  • Number of Airbnb listings: 7,856
  • Number of VRBO listings: 679
  • Average Occupancy Rate: 38% 
  • Average Nightly Rate: $49
  • Monthly Revenue: $472
  • Annual Revenue: $7,104
  • International Traveller Ratio: 97% 
  • Biggest traveller’s origin: Russia
  • Biggest domestic traveller’s origin: Moscow 
  • Most common guests language: English
  • Peak season: September
  • Avg. Cost of Living Per Month: $525
  • Internet Speed: 25mbps
  • Visa Length: 30 – 90 days according to Georgia visa requirements
Ubud, Indonesia
Ubud

Are you looking for a peaceful nomadic lifestyle? If yes, then Ubud is definitely the place to go. Aside from spiritual-oriented locals, you can also enjoy healthy food options & yoga to make sure that your work is balanced with meditation!

  • Number of Airbnb listings: 3,553
  • Number of VRBO listings: 385
  • Average Occupancy Rate: 23% 
  • Average Nightly Rate: $104
  • Monthly Revenue: $689
  • Annual Revenue: $9,144
  • International Traveller Ratio: 50% 
  • Biggest traveller’s origin: USA
  • Biggest domestic traveller’s origin: London 
  • Most common guests language: English
  • Peak season: December
  • Avg. Cost of Living Per Month: $1,729
  • Internet Speed: 13mbps
  • Visa Length: 30 days for a single entry according to Indonesia visa requirements
Valparaiso, Chile
Airbnb occupancy rates in digital nomad cities

Valparaiso is a Bohemian city by the sea that offers stable wifi & a sweet view of the ocean anywhere you go. For digital nomads who prefer to have a quiet time to focus on work, this is the best city for you.

  • Number of Airbnb listings: 795
  • Number of VRBO listings: 20
  • Average Occupancy Rate: 31% 
  • Average Nightly Rate: $97
  • Monthly Revenue: $644
  • Annual Revenue: $11,628
  • International Traveller Ratio: 67% 
  • Biggest traveller’s origin: USA
  • Biggest domestic traveller’s origin: Santiago 
  • Most common guests language: English
  • Peak season: January
  • Avg. Cost of Living Per Month: $1,558
  • Internet Speed: 15mbps
  • Visa Length: 90-day visa-free stay in Chile for 90 nationalities. There is an extension for an additional 90 days is possible at immigration offices according to Chilean Immigration Department

General conclusion

The data points mentioned in this article such as Airbnb occupancy rates per city, annual revenue, & traveller’s ratio should be your basis for either being a digital nomad yourself or targeting them for your business. Now that you have 50 various options for digital nomad cities in the world to choose from, choose to stand out among your competitors by having an access to a reliable data analytics tool!

Now that you have a background of the average figures for each digital nomad city in the world, don’t miss out on greater opportunities! With the help of our all-in-one analytics service, you can vastly enhance your monthly revenue, create a comparison for each neighborhood, add the appropriate amenities and so many more exciting features.

Categories
Airbnb Occupancy All About Airbnb

Airbnb Occupancy Rates by City in 2022

In the Airbnb business industry, one of the most essential performance indicators that you must consider is the occupancy rate of your property. While it’s awesome to post your short-term rental property on Airbnb, the work doesn’t simply end there! Based on our podcast entitled Into The Airbnb, the majority of successful Airbnb hosts state that one of the important ingredient to success is a little help from an accurate data analytics tool. 

Relatively, if you are looking forward to starting your own Airbnb Rental Arbitrage, a thorough research should be backed up with advanced technology in order for you to learn how much you can make using an Airbnb calculator.

In this article, we have carefully filtered the data where you can easily find the average occupancy rates, daily rates, annual & monthly revenues, and the number of listings for over 300 cities in the world. In order to obtain accurate data for this research, we utilized our Airbnb calculator and categorized the cities alphabetically, so you can search for your preferred city!

A-Z LISTING OF MAJOR CITIES
Airbnb Daily Rates & Average Length of Stay in 2021

Source: Airbnb 2022 Q4 SEC Filling

Here’s an interesting observation! In comparison to the data 2020, we saw an increase in GBV per night & experience booked last year 2021. As seen on the bar graph above, the demand for longer stays have increased. Therefore, it is expected that our blended global average nights per booking will continue to fluctuate based on our geographic mix and changes in traveler behaviors. In summary, the total daily rate is $156 with an average number of 4.1 nights. 

So without further ado, let’s dive in and check out the Airbnb data that we discovered for some of the major cities in the world!

Airbnb Statistics for Major Cities:

airbnb occupancy rates by city
AMSTERDAM, NETHERLANDS

Amsterdam is a city and a port in the Netherlands. It is also the principal commercial and financial centre.

  • Number of Airbnb listings: 4,087
  • Number of VRBO listings: 631 
  • Average Occupancy Rate: 37% 
  • Average Nightly Rate: $179 
  • Annual Revenue: $25,056 
  • International Traveller Ratio: 10% 
  • Biggest traveller’s origin: USA 
  • Biggest domestic traveller’s origin: London
  • Most common guests’ language: English 
  • Peak season: September
athens-greece-
ATHENS, GREECE

Athens is a historic city and capital of Greece. Many of Classical civilization’s intellectual and artistic ideas originated in this city.

  • Number of Airbnb listings: 7,900
  • Number of VRBO listings: 2,000 
  • Average Occupancy Rate: 42% 
  • Average Nightly Rate: $77 
  • Annual Revenue: $10,668 
  • International Traveller Ratio: 50% 
  • Biggest traveller’s origin: USA 
  • Biggest domestic traveller’s origin: London
  • Most common guests’ language: English 
  • Peak season: July – September
airbnb occupancy rates by city
ATLANTA CITY, USA

Atlanta is Georgia’s largest city and the principal trade and transportation centre of the southeastern United States. 

  • Number of Airbnb listings: 7,041
  • Number of VRBO listings: 1,155 
  • Average Occupancy Rate: 41% 
  • Average Nightly Rate: $219 
  • Annual Revenue: $37,332 
  • International Traveller Ratio: 33% 
  • Biggest traveller’s origin: Canada 
  • Biggest domestic traveller’s origin: Atlanta
  • Most common guest’s language: English 
  • Peak season: June – August
airbnb occupancy rates by city
AUCKLAND, NEW ZEALAND

Auckland is New Zealand’s most populous city and is a multi-cultural hub of food, music, arts, and culture.

  • Number of Airbnb listings: 2,319
  • Number of VRBO listings: 323 
  • Average Occupancy Rate: 39% 
  • Average Nightly Rate: $143 
  • Annual Revenue: $23,340 
  • International Traveller Ratio: 39% 
  • Biggest traveller’s origin: Australia 
  • Biggest domestic traveller’s origin: Auckland
  • Most common guests’ language: English 
  • Peak season: March
airbnb occupancy rates by city
AUSTIN, TEXAS

Austin is located in central Texas, at the boundary between the Texas Hill Country and the prairies of East Texas.

  • Number of Airbnb listings: 7,414
  • Number of VRBO listings: 2,082 
  • Average Occupancy Rate: 54% 
  • Average Nightly Rate: $183 
  • Annual Revenue: $41,628 
  • International Traveller Ratio: 10% 
  • Biggest traveller’s origin: Canada
  • Biggest domestic traveller’s origin: Houston
  • Most common guests’ language: English 
  • Peak season: October
airbnb occupancy rates by city
BANGKOK, THAILAND

Bangkok is the only cosmopolitan city in a country of small towns and villages and is Thailand’s cultural and commercial center.

  • Number of Airbnb listings: 14,443
  • Number of VRBO listings: 1,365 
  • Average Occupancy Rate: 23% 
  • Average Nightly Rate: $57 
  • Annual Revenue: $5,328 
  • International Traveller Ratio: 75% 
  • Biggest travellers origin: USA
  • Biggest domestic travellers origin: Bangkok
  • Most common guests language: English 
  • Peak season: February
airbnb occupancy rates by city
BARCELONA, SPAIN

Barcelona is the largest city on the Mediterranean coast. This city is famous for its outstanding football team, stunning architecture, lively nightlife, sandy beaches, and world-class cuisine. 

  • Number of Airbnb listings: 10,841
  • Number of VRBO listings: 2,550 
  • Average Occupancy Rate: 46% 
  • Average Nightly Rate: $143 
  • Annual Revenue: $28,572 
  • International Traveller Ratio: 83% 
  • Biggest traveller’s origin: USA
  • Biggest domestic traveller’s origin: Barcelona
  • Most common guests’ language: English 
  • Peak season: July – August
airbnb occupancy rates by city
BATUMI, GEORGIA

Batumi is the second-largest city in Georgia and the capital of the Autonomous Republic of Adjara, located on the coast of the Black Sea in Georgia’s southwest.

  • Number of Airbnb listings: 5,138
  • Number of VRBO listings: 187 
  • Average Occupancy Rate: 25% 
  • Average Nightly Rate: $45 
  • Annual Revenue: $4,476 
  • International Traveller Ratio: 80% 
  • Biggest traveller’s origin: Russia
  • Biggest domestic traveller’s origin: Tbilisi
  • Most common guests’ language: Russian 
  • Peak season: August
airbnb occupancy rates by city
BERLIN, GERMANY

Berlin is the capital and chief urban center of Germany. This city is famous for its many museums such as the Dahlem Museums, the Egyptian Museum, the Berlin Cultural Forum with the New National Gallery, and the Museum of Arts and Crafts.

  • Number of Airbnb listings: 7,032
  • Number of VRBO listings: 584 
  • Average Occupancy Rate: 44% 
  • Average Nightly Rate: $113 
  • Annual Revenue: $20,832 
  • International Traveller Ratio: 75% 
  • Biggest traveller’s origin: USA
  • Biggest domestic traveller’s origin: New York
  • Most common guests’ language: English
  • Peak season: September
airbnb occupancy rates by city
BEYOGLU, TURKEY

Beyoglu is the district on the north bank of the Golden Horn, from Karaköy and the Galata Bridge to Taksim Square. Beyoglu is one of the most popular districts of Istanbul famous for its lively atmosphere, Galata Tower, Taksim Square & cultural activities.

  • Number of Airbnb listings: 4,769
  • Number of VRBO listings: 353 
  • Average Occupancy Rate: 45% 
  • Average Nightly Rate: $63 
  • Annual Revenue: $11,628 
  • International Traveller Ratio: 71% 
  • Biggest travellers origin: USA
  • Biggest domestic travellers origin: Istanbul
  • Most common guests language: English
  • Peak season: December to February
airbnb occupancy rates by city
BOGOTA, COLUMBIA

Bogotá occupies a sloping plain at the base of two mountains, Guadalupe and Monserrate, upon whose crests stand two imposing churches.

  • Number of Airbnb listings: 12,284
  • Number of VRBO listings: 636 
  • Average Occupancy Rate: 34% 
  • Average Nightly Rate: $49 
  • Annual Revenue: $6,672 
  • International Traveller Ratio: 23% 
  • Biggest traveller’s origin: Columbia
  • Biggest domestic traveller’s origin: Bogota
  • Most common guests’ language: Spanish
  • Peak season: February
airbnb occupancy rates by city
BORDEAUX, FRANCE

Bordeaux, a city and a port, is the capital of Gironde département, Nouvelle-Aquitaine région, southwestern France.

  • Number of Airbnb listings: 6,449
  • Number of VRBO listings: 1,101 
  • Average Occupancy Rate: 45% 
  • Average Nightly Rate: $107 
  • Annual Revenue: $19,740 
  • International Traveller Ratio: 33% 
  • Biggest traveller’s origin: UK
  • Biggest domestic traveller’s origin: Paris
  • Most common guests’ language: French
  • Peak season: August – September
airbnb occupancy rates by city
BROOKLYN, NEW YORK

Brooklyn is a borough of New York City, coextensive with Kings County, in the U.S. state of New York. Brooklyn has several bridges and tunnel connections to the borough of Manhattan across the East River and the Verrazzano-Narrows Bridge connect it with Staten Island.

  • Number of Airbnb listings: 7,454
  • Number of VRBO listings: 224 
  • Average Occupancy Rate: 52% 
  • Average Nightly Rate: $166 
  • Annual Revenue: $37,836 
  • International Traveller Ratio: 25% 
  • Biggest traveller’s origin: France
  • Biggest domestic traveller’s origin: New York
  • Most common guests’ language: English
  • Peak season: September
budapest
BUDAPEST, HUNGARY

Budapest City is the political, administrative, industrial, and commercial center of Hungary.

  • Number of Airbnb listings: 5,478
  • Number of VRBO listings: 668
  • Average Occupancy Rate: 45% 
  • Average Nightly Rate: $89 
  • Annual Revenue: $16,464 
  • International Traveller Ratio: 45% 
  • Biggest traveller’s origin: UK
  • Biggest domestic traveller’s origin: London
  • Most common guests’ language: English
  • Peak season: December
Buenos Aires
BUENOS AIRES, ARGENTINA

Buenos Aires is located on the western shore of the estuary of the Río de la Plata, on the South American continent’s southeastern coast.

  • Number of Airbnb listings: 15,510
  • Number of VRBO listings: 1,135
  • Average Occupancy Rate: 34% 
  • Average Nightly Rate: $48 
  • Annual Revenue: $6,876 
  • International Traveller Ratio: 86% 
  • Biggest traveller’s origin: Brazil
  • Biggest domestic traveller’s origin: Buenos Aires
  • Most common guests’ language: Spanish
  • Peak season: February
Calgary
CALGARY, CANADA

The city of Calgary is situated on the Bow River in southern Alberta, about 220 km north of the American border at the meeting point of the Western prairies and mountain foothills.

  • Number of Airbnb listings: 4,485
  • Number of VRBO listings: 907
  • Average Occupancy Rate: 47% 
  • Average Nightly Rate: $99 
  • Annual Revenue: $20,688 
  • International Traveller Ratio: 60% 
  • Biggest traveller’s origin: USA
  • Biggest domestic traveller’s origin: Edmonton
  • Most common guests’ language: English
  • Peak season: July – September
airbnb occupancy rates by city
CALI, COLOMBIA

Cali is known by the rest Colombia as the “Rumba Capital” and by the world as the “Salsa Capital”, thanks to its characteristic street parties and dance.

  • Number of Airbnb listings: 4,226
  • Number of VRBO listings: 292
  • Average Occupancy Rate: 32% 
  • Average Nightly Rate: $40
  • Annual Revenue: $5,220 
  • International Traveller Ratio: 24% 
  • Biggest traveller’s origin: Columbia
  • Biggest domestic traveller’s origin: Bogota
  • Most common guests’ language: Spanish
  • Peak season: December
airbnb occupancy rates by city
CANNES, FRANCE

Cannes, a resort town on the French Riviera, is famed for its international film festival. Its Boulevard de la Croisette, curving along the coast, is lined with sandy beaches, upmarket boutiques and palatial hotels. 

  • Number of Airbnb listings: 4,087
  • Number of VRBO listings: 631 
  • Average Occupancy Rate: 37% 
  • Average Nightly Rate: $179 
  • Annual Revenue: $25,056 
  • International Traveller Ratio: 10% 
  • Biggest traveller’s origin: USA 
  • Biggest domestic traveller’s origin: London
  • Most common guests’ language: English 
  • Peak season: September
airbnb occupancy rates by city
CAPE TOWN, SOUTH AFRICA

Cape Town, city and seaport, legislative capital of South Africa and capital of Western Cape province.

  • Number of Airbnb listings: 10,716
  • Number of VRBO listings: 1,458
  • Average Occupancy Rate: 38% 
  • Average Nightly Rate: $86
  • Annual Revenue: $13,308 
  • International Traveller Ratio: 38% 
  • Biggest traveller’s origin: Germany
  • Biggest domestic traveller’s origin: Cape Town
  • Most common guests’ language: English
  • Peak season: December – February
CARTAGENA, COLUMBIA

Cartagena is a city that is located on the shores of the Caribbean Sea, in the northwestern part of the South American continent.

  • Number of Airbnb listings: 5,830
  • Number of VRBO listings: 824
  • Average Occupancy Rate: 43% 
  • Average Nightly Rate: $76
  • Annual Revenue: $12,972 
  • International Traveller Ratio: 40% 
  • Biggest traveller’s origin: Columbia
  • Biggest domestic traveller’s origin: Bogota
  • Most common guests’ language: Spanish
  • Peak season: December
Cebu City
CEBU CITY, PHILIPPINES

Cebu City is the oldest city in the Philippines, in the Province of Cebu. It is often called the “Queen City of the South” located in the country’s Central Visayas region.

  • Number of Airbnb listings: 4,538
  • Number of VRBO listings: 402
  • Average Occupancy Rate: 16% 
  • Average Nightly Rate: $52
  • Annual Revenue: $3,432 
  • International Traveller Ratio: 16% 
  • Biggest traveller’s origin: USA
  • Biggest domestic traveller’s origin: Cebu City
  • Most common guests’ language: English
  • Peak season: January – February
CHARLOTTE, NORTH CAROLINA

Charlotte is the most populous city in the U.S. state of North Carolina. Located in the Piedmont region, it is the county seat of Mecklenburg County.

  • Number of Airbnb listings: 1,207
  • Number of VRBO listings: 1,415
  • Average Occupancy Rate: 48% 
  • Average Nightly Rate: $160
  • Annual Revenue: $36,204
  • International Traveller Ratio: 48% 
  • Biggest traveller’s origin: Canada
  • Biggest domestic traveller’s origin: Miami
  • Most common guests’ language: English
  • Peak season: March
airbnb occupancy rates by city
CHICAGO, ILLINOIS

Chicago is located in the Midwest along the Great Lakes shoreline. It is the third largest city and metropolitan area in the United States.

  • Number of Airbnb listings: 4,546
  • Number of VRBO listings: 927
  • Average Occupancy Rate: 52% 
  • Average Nightly Rate: $147
  • Annual Revenue: $34,032
  • International Traveller Ratio: 9% 
  • Biggest traveller’s origin: Canada
  • Biggest domestic traveller’s origin: Chicago
  • Most common guests’ language: English
  • Peak season: July – September
Cordoba Argentina
COPENHAGEN, DENMARK

Copenhagen is the capital and largest city of Denmark. It is located on the islands of Zealand and Amager, at the southern end of The Sound.

  • Number of Airbnb listings: 3,633
  • Number of VRBO listings: 413
  • Average Occupancy Rate: 35% 
  • Average Nightly Rate: $176
  • Annual Revenue: $24,636
  • International Traveller Ratio: 85% 
  • Biggest traveller’s origin: USA
  • Biggest domestic traveller’s origin: London
  • Most common guests’ language: English
  • Peak season: September
Pro Book Airbtics US

Secure Your Download

Airbnb & Real Estate Insights, Top 50 Cities!

Cordoba Argentina
CÓRDOBA, ARGENTINA

Córdoba is the second largest city in Argentina, with about 1.4 million inhabitants, and is the capital of the Cordoba province. It is in the heart of the Argentine territory on the Pampas.

  • Number of Airbnb listings: 1,371
  • Number of VRBO listings: 21
  • Average Occupancy Rate: 32% 
  • Average Nightly Rate: $77
  • Annual Revenue: $9,492
  • International Traveller Ratio: 57% 
  • Biggest traveller’s origin: USA
  • Biggest domestic traveller’s origin: Buenos Aires
  • Most common guests’ language: Spanish
  • Peak season: November
airbnb occupancy rates by city
DALLAS, TEXAS

Dallas is the ninth-largest city in the United States located in the north-central part of the state near the junction of the Trinity River’s three forks.

  • Number of Airbnb listings: 5,205
  • Number of VRBO listings: 1,103
  • Average Occupancy Rate: 47% 
  • Average Nightly Rate: $123
  • Annual Revenue: $25,956
  • International Traveller Ratio: 11% 
  • Biggest traveller’s origin: Canada
  • Biggest domestic traveller’s origin: Dallas
  • Most common guests’ language: English
  • Peak season: July
airbnb occupancy rates by city
DAVENPORT, IOWA

Located approximately halfway between Chicago & Des Moines, Davenport is on the border of Iowa across the river from Illinois.

  • Number of Airbnb listings: 205
  • Number of VRBO listings: 42
  • Average Occupancy Rate: 50% 
  • Average Nightly Rate: $103
  • Annual Revenue: $22,032
  • International Traveller Ratio: 20% 
  • Biggest traveller’s origin: UK
  • Biggest domestic traveller’s origin: Chicago
  • Most common guests’ language: English
  • Peak season: July
Denver
DENVER, COLORADO

Denver is an outdoor city known for its art, culture, food, music and sports in the Rocky Mountain region. Denver lies at the junction of Cherry Creek and the South Platte River.

  • Number of Airbnb listings: 3,505
  • Number of VRBO listings: 783
  • Average Occupancy Rate: 60% 
  • Average Nightly Rate: $136
  • Annual Revenue: $37,140
  • International Traveller Ratio: 17% 
  • Biggest traveller’s origin: Canada
  • Biggest domestic traveller’s origin: Denver
  • Most common guests’ language: English
  • Peak season: August – September
airbnb occupancy rates by city
DUBAI, UAE

Dubai is a city of skyscrapers, ports, and beaches, where big business takes place alongside sun-seeking tourism. Because of its large expatriate population, it feels like a Middle Eastern melting pot, and the atmosphere is generally tolerant.

  • Number of Airbnb listings: 10,126
  • Number of VRBO listings: 1,302
  • Average Occupancy Rate: 41% 
  • Average Nightly Rate: $171
  • Annual Revenue: $28,584
  • International Traveller Ratio: 65% 
  • Biggest traveller’s origin: USA
  • Biggest domestic traveller’s origin: Dubai
  • Most common guests’ language: English
  • Peak season: December
airbnb occupancy rates by city
DUBROVNIK, CROATIA

Situated on the southern Adriatic Sea coast, Dubrovnik is usually regarded as the most picturesque city on the Dalmatian coast and is referred to as the “Pearl of the Adriatic.”

  • Number of Airbnb listings: 3,418
  • Number of VRBO listings: 1,657
  • Average Occupancy Rate: 33% 
  • Average Nightly Rate: $319
  • Annual Revenue: $39,396
  • International Traveller Ratio: 98% 
  • Biggest traveller’s origin: USA
  • Biggest domestic traveller’s origin: London
  • Most common guests’ language: English
  • Peak season: March
Edinburgh
EDINBURGH, SCOTLAND

Edinburgh is the capital city of Scotland located in southeastern Scotland with its center near the southern shore of the Firth of Forth.

  • Number of Airbnb listings: 5,000
  • Number of VRBO listings: 1,257
  • Average Occupancy Rate: 52% 
  • Average Nightly Rate: $175
  • Annual Revenue: $37,212
  • International Traveller Ratio: 33% 
  • Biggest traveller’s origin: USA
  • Biggest domestic traveller’s origin: London
  • Most common guests’ language: English
  • Peak season: August
airbnb occupancy rates by city
FLORENCE, ITALY

This city is located about 145 miles northwest of Rome and is surrounded by gently rolling hills that are covered with villas and farms, vineyards, and orchards.

  • Number of Airbnb listings: 6,357
  • Number of VRBO listings: 2,695
  • Average Occupancy Rate: 35% 
  • Average Nightly Rate: $143
  • Annual Revenue: $20,304
  • International Traveller Ratio: 78% 
  • Biggest traveller’s origin: USA
  • Biggest domestic traveller’s origin: New York
  • Most common guests’ language: English
  • Peak season: August – September
Gdansk
GDANSK, POLAND

Situated on the coast of the Baltic Sea, Gdansk is Poland’s principal seaport and one of its biggest tourist destinations. It boasts several important historical attractions.

  • Number of Airbnb listings: 4,411
  • Number of VRBO listings: 430
  • Average Occupancy Rate: 36% 
  • Average Nightly Rate: $112
  • Annual Revenue: $16,344
  • International Traveller Ratio: 75
  • Biggest traveller’s origin: Germany
  • Biggest domestic traveller’s origin: Warsaw
  • Most common guests’ language: Polish
  • Peak season: August
GREATER LONDON, ENGLAND

Greater London is an administrative area, ceremonial county, and the London region of England. It was created as an area for local government on 1 April 1965, comprising the City of London and 32 London boroughs.

  • Number of Airbnb listings: 5,997
  • Number of VRBO listings: 1,440
  • Average Occupancy Rate: 42% 
  • Average Nightly Rate: $183
  • Annual Revenue: $32,016
  • International Traveller Ratio: 60% 
  • Biggest traveller’s origin: USA
  • Biggest domestic traveller’s origin: London
  • Most common guests’ language: English
  • Peak season: September
airbnb occupancy rates by city
HONG KONG, CHINA

Hong Kong has one of the world’s most thriving economies and is a hub for international trade and investment. A cosmopolitan city, Hong Kong weaves Western and Asian influence into a world-class center of business, culture, and trade.

  • Number of Airbnb listings: 1,581
  • Number of VRBO listings: 186
  • Average Occupancy Rate: 29% 
  • Average Nightly Rate: $165
  • Annual Revenue: $18,804
  • International Traveller Ratio: 54% 
  • Biggest travellers origin: USA
  • Biggest domestic travellers origin: Hong Kong Island
  • Most common guests language: English
  • Peak season: August – September
airbnb occupancy rates by city
HOUSTON, TEXAS

Houston is expected to become the third most populous U.S. city during the second half of the decade of the 2020s. Greater Houston is the most ethnically diverse metropolitan area in the United States. 

  • Number of Airbnb listings: 8,632
  • Number of VRBO listings: 1,299
  • Average Occupancy Rate: 43% 
  • Average Nightly Rate: $232
  • Annual Revenue: $40,452
  • International Traveller Ratio: 25% 
  • Biggest traveller’s origin: Canada
  • Biggest domestic traveller’s origin: Houston
  • Most common guests’ language: English
  • Peak season: March
johor bahru
JOHOR BAHRU, MALAYSIA

Johor Bahru is the capital of the state of Johor, Malaysia. It is located along the Straits of Johor at the southern end of Peninsular Malaysia.

  • Number of Airbnb listings: 536
  • Number of VRBO listings: 44
  • Average Occupancy Rate: 19% 
  • Average Nightly Rate: $54
  • Annual Revenue: $4,140
  • International Traveller Ratio: 50
  • Biggest traveller’s origin: Indonesia
  • Biggest domestic traveller’s origin: Kuala Lumpur
  • Most common guests’ language: English
  • Peak season: January
Kiev Ukraine
KIEV, UKRAINE

Kiev is the chief city and capital of Ukraine. A port on the Dnieper (Dnipro) River and a large railroad junction, it is a city with an ancient and proud history.

  • Number of Airbnb listings: 5,468
  • Number of VRBO listings: 423
  • Average Occupancy Rate: 39% 
  • Average Nightly Rate: $97
  • Annual Revenue: $14,616
  • International Traveller Ratio: 85
  • Biggest travellers origin: USA
  • Biggest domestic travellers origin: Kiev
  • Most common guests language: English
  • Peak season: September
airbnb occupancy rates by city
KISSIMMEE, FLORIDA

Kissimmee is the largest city and county seat of Osceola County, Florida, United States. The name ‘Kissimmee’ itself means long water, and the city is named after the Kissimmee River. 

  • Number of Airbnb listings: 1,746
  • Number of VRBO listings: 1,288
  • Average Occupancy Rate: 65% 
  • Average Nightly Rate: $90
  • Annual Revenue: $28,044
  • International Traveller Ratio: 40
  • Biggest traveller’s origin: Brazil
  • Biggest domestic traveller’s origin: Miami
  • Most common guests’ language: English
  • Peak season: June – July
Krakow poland
KRAKÓW, POLAND

Kraków was the official capital of Poland until 1596 and has traditionally been one of the leading centres of Polish academic, economic, cultural and artistic life. It is also one of Europe’s most beautiful cities.

  • Number of Airbnb listings: 4,330
  • Number of VRBO listings: 767
  • Average Occupancy Rate: 41% 
  • Average Nightly Rate: $69
  • Annual Revenue: $11,460
  • International Traveller Ratio: 88% 
  • Biggest traveller’s origin: UK
  • Biggest domestic traveller’s origin: London
  • Most common guests’ language: English
  • Peak season: December
Krong Siem Reap
KRONG SIEM REAP, CAMBODIA

Siem Reap is a cluster of small villages along the Siem Reap River. These villages were originally developed around Buddhist pagodas (wats).

  • Number of Airbnb listings: 2,931
  • Number of VRBO listings: 278
  • Average Occupancy Rate: 16% 
  • Average Nightly Rate: $70
  • Annual Revenue: $4,344
  • International Traveller Ratio: 75% 
  • Biggest traveller’s origin: USA
  • Biggest domestic traveller’s origin: London
  • Most common guests’ language: English
  • Peak season: February
Kuala Lumpur
KUALA LUMPUR, MALAYSIA

Kuala Lumpur is the stunning capital of Malaysia. The city, defined by its colorful culture and rich natural reserves, is also Malaysia’s largest city.

  • Number of Airbnb listings: 8,847
  • Number of VRBO listings: 1,211
  • Average Occupancy Rate: 24% 
  • Average Nightly Rate: $130
  • Annual Revenue: $11,808
  • International Traveller Ratio: 39
  • Biggest traveller’s origin: Indonesia
  • Biggest domestic traveller’s origin: Kuala Lumpur
  • Most common guests’ language: English
  • Peak season: January
airbnb occupancy rates by city
KUTA, INDONESIA

Kuta is a tourist area, administratively an urban village (kelurahan), and the capital of Kuta District, Badung Regency, southern Bali, Indonesia.

  • Number of Airbnb listings: 568
  • Number of VRBO listings: 73
  • Average Occupancy Rate: 12% 
  • Average Nightly Rate: $179
  • Annual Revenue: $2,940
  • International Traveller Ratio: 33
  • Biggest traveller’s origin: USA
  • Biggest domestic traveller’s origin: Jakarta
  • Most common guests’ language: English
  • Peak season: August
HAVANA, CUBA

Havana is the cultural center of Cuba. It offers museums, palaces, public squares, avenues, churches, and fortresses including the largest fortified complex in America dating from the 16th through 18th centuries.

  • Number of Airbnb listings: 5,695
  • Number of VRBO listings: 0
  • Average Occupancy Rate: 26% 
  • Average Nightly Rate: $48
  • Annual Revenue: $5,148
  • Biggest traveller’s origin: USA
  • Biggest domestic traveller’s origin: New York
  • Most common guests’ language: English
  • Peak season: February
LAGOS, PORTUGAL

Lagos is a Portuguese town in the district of Faro, region, and sub-region of Algarve, in southern Portugal.

  • Number of Airbnb listings: 1,232
  • Number of VRBO listings: 517
  • Average Occupancy Rate: 41% 
  • Average Nightly Rate: $109
  • Annual Revenue: $18,852
  • International Traveller Ratio: 43
  • Biggest traveller’s origin: USA
  • Biggest domestic traveller’s origin: London
  • Most common guests’ language: English
  • Peak season: August
LAS VEGAS, NEVADA

Las Vegas is known for its casinos and world-class entertainment and is Nevada’s economic centre and largest city.

  • Number of Airbnb listings: 1,312
  • Number of VRBO listings: 283
  • Average Occupancy Rate: 51% 
  • Average Nightly Rate: $113
  • Annual Revenue: $26,736
  • International Traveller Ratio: 22
  • Biggest traveller’s origin: Canada
  • Biggest domestic traveller’s origin: Los Angeles
  • Most common guests’ language: English
  • Peak season: September
Lisbon
LISBON, PORTUGAL

Lisbon is recognized as an alpha-level global city because of its importance in finance, commerce, media, entertainment, arts, international trade, education and tourism. Lisbon is one of two Portuguese cities to be recognized as a global city.

  • Number of Airbnb listings: 9,502
  • Number of VRBO listings: 3,319
  • Average Occupancy Rate: 49% 
  • Average Nightly Rate: $104
  • Annual Revenue: $21,228
  • International Traveller Ratio: 50
  • Biggest traveller’s origin: France
  • Biggest domestic traveller’s origin: Paris
  • Most common guests’ language: English
  • Peak season: October
London
LONDON, ENGLAND

London is the capital city of the United Kingdom. It is the U.K.’s largest metropolis and its economic, transportation, and cultural centre. London is also among the oldest of the world’s great cities, with its history spanning nearly two millennia.

  • Number of Airbnb listings: 8,827
  • Number of VRBO listings: 2,921
  • Average Occupancy Rate: 41% 
  • Average Nightly Rate: $226
  • Annual Revenue: $44,424
  • International Traveller Ratio: 60% 
  • Biggest traveller’s origin: USA
  • Biggest domestic traveller’s origin: London
  • Most common guests’ language: English
  • Peak season: September
Los Angeles
LOS ANGELES, CALIFORNIA

The city of Los Angeles is the most populous city in California. Located on a broad basin in Southern California, the city is surrounded by vast mountain ranges, valleys, forests, beautiful beaches along the Pacific Ocean, and nearby deserts.

  • Number of Airbnb listings: 12,092
  • Number of VRBO listings: 1,471
  • Average Occupancy Rate: 51% 
  • Average Nightly Rate: $173
  • Annual Revenue: $40,812
  • International Traveller Ratio: 21
  • Biggest traveller’s origin: Canada
  • Biggest domestic traveller’s origin: Los Angeles
  • Most common guests’ language: English
  • Peak season: September
Lyon France
LYON, FRANCE

Lyon is the capital of both the Rhône département and the Auvergne-Rhône-Alpes région, east-central France, set on a hilly site at the confluence of the Rhône and Saône rivers. It is the third-largest city in France, after Paris and Marseille. 

  • Number of Airbnb listings: 8,827
  • Number of VRBO listings: 2,921
  • Average Occupancy Rate: 41% 
  • Average Nightly Rate: $226
  • Annual Revenue: $44,424
  • International Traveller Ratio: 60% 
  • Biggest traveller’s origin: USA
  • Biggest domestic traveller’s origin: London
  • Most common guests’ language: French
  • Peak season: October – December
airbnb occupancy rates by city
MADRID, SPAIN

Madrid is the capital of Spain and is home to the Spanish Royal family & the Spanish Government. It is a modern metropolitan city & an economic and industrial center of Spain.

  • Number of Airbnb listings: 11,953
  • Number of VRBO listings: 2,154
  • Average Occupancy Rate: 50% 
  • Average Nightly Rate: $150
  • Annual Revenue: $30,456
  • International Traveller Ratio: 77% 
  • Biggest traveller’s origin: USA
  • Biggest domestic traveller’s origin: Madrid
  • Most common guests’ language: Spanish
  • Peak season: September
airbnb occupancy rates by city
MÁLAGA, SPAIN

Málaga is a large city in the southern Spanish region of Andalucia and capital of the Málaga Province. The largest city on the Costa del Sol, Malaga is known as the birthplace of the famous Spanish artist Pablo Picasso.

  • Number of Airbnb listings: 4,848
  • Number of VRBO listings: 1,993
  • Average Occupancy Rate: 50
  • Average Nightly Rate: $113
  • Annual Revenue: $23,136
  • International Traveller Ratio: 89% 
  • Biggest traveller’s origin: UK
  • Biggest domestic traveller’s origin: Madrid
  • Most common guests’ language: English
  • Peak season: August
airbnb occupancy rates by city
MARBELLA, SPAIN

Marbella is known as a glamorous resort town and is a favorite location with the rich and famous, boosted by foreign residents who are seduced by the lifestyle. 

  • Number of Airbnb listings: 533
  • Number of VRBO listings: 210
  • Average Occupancy Rate: 44% 
  • Average Nightly Rate: $151
  • Annual Revenue: $27,000
  • International Traveller Ratio: 70% 
  • Biggest traveller’s origin: UK
  • Biggest domestic traveller’s origin: Madrid
  • Most common guests’ language: English
  • Peak season: August
airbnb occupancy rates by city
MARRAKECH, MOROCCO

Marrakech, also spelled Marrakesh, is the chief city of central Morocco. The ancient section of the city, known as the medina, was designated a UNESCO World Heritage site in 1985

  • Number of Airbnb listings: 6,638
  • Number of VRBO listings: 1,549
  • Average Occupancy Rate: 23
  • Average Nightly Rate: $109
  • Annual Revenue: $9,684
  • International Traveller Ratio: 67% 
  • Biggest traveller’s origin: France
  • Biggest domestic traveller’s origin: Paris
  • Most common guests’ language: English
  • Peak season: August
airbnb occupancy rates by city
MARSEILLE, FRANCE

Located west of the French Riviera, Marseille is one of the major ports of the Mediterranean Sea. It is situated on the Mediterranean’s Gulf of Lion within a semicircle of limestone hills and lies 536 miles (863 kilometers) south-southeast of Paris.

  • Number of Airbnb listings: 4,646
  • Number of VRBO listings: 715
  • Average Occupancy Rate: 43% 
  • Average Nightly Rate: $97
  • Annual Revenue: $17,424
  • International Traveller Ratio: 53% 
  • Biggest traveller’s origin: Germany
  • Biggest domestic traveller’s origin: Paris
  • Most common guests’ language: French
  • Peak season: July – August
airbnb occupancy rates by city
MEDELLIN, COLUMBIA

Medellín is Colombia’s second-largest city and is nestled in the Aburrá Valley of the Andes Mountains. It was founded in 1616 but remained a small, under-the-radar locale until the Colombian coffee boom. It later became the center of the textile industry.

  • Number of Airbnb listings: 7,326
  • Number of VRBO listings: 777
  • Average Occupancy Rate: 47
  • Average Nightly Rate: $54
  • Annual Revenue: $10,608
  • International Traveller Ratio: 47% 
  • Biggest traveller’s origin: USA
  • Biggest domestic traveller’s origin: Bogota
  • Most common guests’ language: English
  • Peak season: December – January
MIAMI, FLORIDA

Miami is a major center and leader in finance, commerce, culture, arts, & international trade. Miami is known for its white-sand beaches, warm climate, delicious cuisine, Cuban coffee, & its Latin-American influences.

  • Number of Airbnb listings: 6,588
  • Number of VRBO listings: 1,326
  • Average Occupancy Rate: 57% 
  • Average Nightly Rate: $183
  • Annual Revenue: $45,660
  • International Traveller Ratio: 10% 
  • Biggest traveller’s origin: Canada
  • Biggest domestic traveller’s origin: New York
  • Most common guests’ language: English
  • Peak season: December – January
Miami Beach
MIAMI BEACH, FLORIDA

Miami Beach is a coastal resort city in Miami-Dade County, Florida, United States. The municipality is located on natural and man-made barrier islands between the Atlantic Ocean and Biscayne Bay, the latter of which separates the Beach from the mainland city of Miami.

  • Number of Airbnb listings: 4,259
  • Number of VRBO listings: 1,193
  • Average Occupancy Rate: 56
  • Average Nightly Rate: $267
  • Annual Revenue: $63,072
  • International Traveller Ratio: 25% 
  • Biggest traveller’s origin: Canada
  • Biggest domestic traveller’s origin: New York
  • Most common guests’ language: English
  • Peak season: February
Milano IT
MILANO, ITALY

Milan is the capital city of the region of Lombardy in northern Italy. It is the second-largest city by population in Italy, behind Rome.

  • Number of Airbnb listings: 11,026
  • Number of VRBO listings: 2,056
  • Average Occupancy Rate: 36% 
  • Average Nightly Rate: $145
  • Annual Revenue: $21,408
  • International Traveller Ratio: 72% 
  • Biggest traveller’s origin: USA
  • Biggest domestic traveller’s origin: Milan
  • Most common guests’ language: English
  • Peak season: September
Montpellier
MONTPELLIER, FRANCE

Montpellier is the third-largest French city near the Mediterranean coast, behind Marseille and Nice. It is the seventh-largest city in France.

  • Number of Airbnb listings: 3,442
  • Number of VRBO listings: 613
  • Average Occupancy Rate: 43
  • Average Nightly Rate: $89
  • Annual Revenue: $14,928
  • International Traveller Ratio: 37% 
  • Biggest traveller’s origin: USA
  • Biggest domestic traveller’s origin: Paris
  • Most common guests’ language: French
  • Peak season: August
airbnb occupancy rates by city
MONTREAL, CANADA

Montreal is a major industrial centre, commercial and financial metropolis, railway and maritime bridgehead, and one of the centres of francophone culture in North America. 

  • Number of Airbnb listings: 6,046
  • Number of VRBO listings: 1,092
  • Average Occupancy Rate: 44% 
  • Average Nightly Rate: $116
  • Annual Revenue: $21,756
  • International Traveller Ratio: 71% 
  • Biggest traveller’s origin: USA
  • Biggest domestic traveller’s origin: Toronto
  • Most common guests’ language: English
  • Peak season: August – September
airbnb occupancy rates by city
MOSCOW, RUSSIA

Moscow, on the Moskva River in western Russia, is the nation’s cosmopolitan capital. In its historic core is the Kremlin, a complex that’s home to the president and tsarist treasures in the Armoury.

  • Number of Airbnb listings: 14,041
  • Number of VRBO listings: 364
  • Average Occupancy Rate: 32
  • Average Nightly Rate: $127
  • Annual Revenue: $15,708
  • International Traveller Ratio: 45% 
  • Biggest traveller’s origin: USA
  • Biggest domestic traveller’s origin: Moscow
  • Most common guests’ language: Russian
  • Peak season: January
Muang Pattaya
MUANG PATTAYA, THAILAND

Pattaya is a city on Thailand’s eastern Gulf coast known for its beaches. A quiet fishing village as recently as the 1960s, it’s now lined with resort hotels, high-rise condos, shopping malls, cabaret bars and 24-hour clubs.

  • Number of Airbnb listings: 2,426
  • Number of VRBO listings: 239
  • Average Occupancy Rate: 17% 
  • Average Nightly Rate: $83
  • Annual Revenue: $5,592
  • International Traveller Ratio: 86% 
  • Biggest traveller’s origin: USA
  • Biggest domestic traveller’s origin: Bangkok
  • Most common guests’ language: English
  • Peak season: February
airbnb occupancy rates by city
MUNICH, GERMANY

Munich is the capital and most populous city of the German state of Bavaria. The city has several of the largest breweries in Germany and is famous for its beer and its annual Oktoberfest celebration. 

  • Number of Airbnb listings: 2,330
  • Number of VRBO listings: 128
  • Average Occupancy Rate: 31
  • Average Nightly Rate: $172
  • Annual Revenue: $21,456
  • International Traveller Ratio: 50% 
  • Biggest traveller’s origin: USA
  • Biggest domestic traveller’s origin: Berlin
  • Most common guests’ language: English
  • Peak season: September
Myrtle Beach
MYRTLE BEACH, USA

Myrtle Beach is a major tourist destination along the South Atlantic coast of South Carolina. It is widely known for its wide beaches, large selection of challenging golf links, excellent seafood restaurants, and outlet-style shopping activities.

  • Number of Airbnb listings: 3,359
  • Number of VRBO listings: 2,357
  • Average Occupancy Rate: 48% 
  • Average Nightly Rate: $151
  • Annual Revenue: $33,012
  • International Traveller Ratio: 14% 
  • Biggest traveller’s origin: Canada
  • Biggest domestic traveller’s origin: Charlotte
  • Most common guests’ language: English
  • Peak season: June
NAIROBI, KENYA

Nairobi, city, capital of Kenya. It is situated in the south-central part of the country and grew due to administration and tourism businesses (mostly big game hunting).

  • Number of Airbnb listings: 7,637
  • Number of VRBO listings: 700
  • Average Occupancy Rate: 26
  • Average Nightly Rate: $51
  • Annual Revenue: $5,352
  • International Traveller Ratio: 78% 
  • Biggest traveller’s origin: USA
  • Biggest domestic traveller’s origin: Nairobi
  • Most common guests’ language: English
  • Peak season: February
airbnb occupancy rates by city
NAPLES, ITALY

Naples is the regional capital of Campania and the third-largest city in Italy. The city center, which is a UNESCO World Heritage site dating back to 470 BC, has many incredible attractions to visit.

  • Number of Airbnb listings: 1,406
  • Number of VRBO listings: 323
  • Average Occupancy Rate: 43% 
  • Average Nightly Rate: $74
  • Annual Revenue: $13,044
  • International Traveller Ratio: 79% 
  • Biggest traveller’s origin: France
  • Biggest domestic traveller’s origin: Paris
  • Most common guests’ language: English
  • Peak season: August
Nashville
NASHVILLE, TENNESSEE

Nashville is the capital of Tennessee and lies on the Cumberland River in the north-central part of the state. It is the centre of an urbanized area that also embraces parts of seven surrounding counties.

  • Number of Airbnb listings: 5,552
  • Number of VRBO listings: 1,965
  • Average Occupancy Rate: 58
  • Average Nightly Rate: $166
  • Annual Revenue: $42,372
  • International Traveller Ratio: 10% 
  • Biggest traveller’s origin: Canada
  • Biggest domestic traveller’s origin: Nashville
  • Most common guests’ language: English
  • Peak season: September – October
airbnb occupancy rates by city
NEW ORLEANS, LOUISIANA

New Orleans is world-renowned for its distinctive music, Creole cuisine, unique dialects, and its annual celebrations and festivals. The historic heart of the city is the French Quarter, known for its French & Spanish Creole architecture and vibrant nightlife along Bourbon Street.

  • Number of Airbnb listings: 5,396
  • Number of VRBO listings: 1,761
  • Average Occupancy Rate: 53% 
  • Average Nightly Rate: $161
  • Annual Revenue: $36,936
  • International Traveller Ratio: 11% 
  • Biggest traveller’s origin: Canada
  • Biggest domestic traveller’s origin: New York
  • Most common guests’ language: English
  • Peak season: February
NEW YORK CITY, NEW YORK

Located where the Hudson and East rivers empty into one of the world’s premier harbours, New York is both the gateway to the North American continent and its preferred exit to the oceans of the globe.

  • Number of Airbnb listings: 14,261
  • Number of VRBO listings: 5,761
  • Average Occupancy Rate: 50
  • Average Nightly Rate: $187
  • Annual Revenue: $40,524
  • International Traveller Ratio: 13% 
  • Biggest traveller’s origin: France
  • Biggest domestic traveller’s origin: New York
  • Most common guests’ language: English
  • Peak season: July – September
Nice France
NICE, FRANCE

Nice is known for its beautiful location on the French Riviera. The French culture and Mediterranean climate have made Nice a popular tourist destination for hundreds of years. The city is also famous for its yearly festival and parades.

  • Number of Airbnb listings: 7,111
  • Number of VRBO listings: 2,239
  • Average Occupancy Rate: 39% 
  • Average Nightly Rate: $126
  • Annual Revenue: $21,204
  • International Traveller Ratio: 50% 
  • Biggest traveller’s origin: USA
  • Biggest domestic traveller’s origin: Paris
  • Most common guests’ language: English
  • Peak season: August
airbnb occupancy rates by city
ORLANDO, FLORIDA

Orlando is the county seat of Orange County. In Central Florida, it is the center of the Orlando metropolitan that attracts around 60 million visitors every year.

  • Number of Airbnb listings: 1,109
  • Number of VRBO listings: 258
  • Average Occupancy Rate: 54
  • Average Nightly Rate: $115
  • Annual Revenue: $27,828
  • International Traveller Ratio: 14% 
  • Biggest traveller’s origin: Canada
  • Biggest domestic traveller’s origin: Orlando
  • Most common guests’ language: English
  • Peak season: February
airbnb occupancy rates by city
PALERMO, ITALY

Palermo is Sicily’s cultural, economic and tourism capital. It is a city rich in history, culture, art, music and food. It is the most conquered city in history, as it has been ruled by 15 different conquering nations. It has a dozen UNESCO Sites.

  • Number of Airbnb listings: 2,210
  • Number of VRBO listings: 672
  • Average Occupancy Rate: 42% 
  • Average Nightly Rate: $72
  • Annual Revenue: $12,600
  • International Traveller Ratio: 91% 
  • Biggest traveller’s origin: France
  • Biggest domestic traveller’s origin: Paris
  • Most common guests’ language: English
  • Peak season: August
Panama City Beach
PANAMA CITY BEACH

Panama City Beach is a resort town in Bay County, Florida, United States, on the Gulf of Mexico coast. The waters at Panama City Beach are famous with fishermen and scuba divers who enjoy the benefits of dozens artificial reefs located offshore, and with a coastline that angles slightly toward the west, you can watch the sunset over the Gulf of Mexico every day of the year.

  • Number of Airbnb listings: 4,537
  • Number of VRBO listings: 5,274
  • Average Occupancy Rate: 51
  • Average Nightly Rate: $177
  • Annual Revenue: $42,216
  • Biggest traveller’s origin: Canada
  • Biggest domestic traveller’s origin: Atlanta
  • Most common guests’ language: English
  • Peak season: July
airbnb occupancy rates by city
PARIS, FRANCE

Paris, the capital city of France, remains and will remain the most beautiful place for learning French while visiting a city overflowing with history. The symbol of the capital city is the unique Eiffel Tower, the “Iron Lady” that offers visitors an unsurpassed view.

  • Number of Airbnb listings: 7,551
  • Average Occupancy Rate: 82% 
  • Average Nightly Rate: €109
  • Revenue Potential: €31,120
  • International Traveller Ratio: 74% 
  • Biggest traveller’s origin: USA
  • Biggest domestic traveller’s origin: Paris
  • Most common guests’ language: French
  • Peak season: September
Park City
PARK CITY, UTAH

Park City is known for three things: skiing, snowboarding and the Sundance Film Festival. Located 35 miles southeast of Salt Lake City, Park City is easily accessible and home to a wide range of accommodations that attract throngs of vacationers during the winter season.

  • Number of Airbnb listings: 2,611
  • Average Occupancy Rate: 48
  • Average Nightly Rate: $420
  • Revenue Potential: $79,118
  • International Traveller Ratio: 6% 
  • Biggest traveller’s origin: United Kingdom
  • Biggest domestic traveller’s origin: New York
  • Most common guests’ language: English
  • Peak season: February
Petaling Jaya
PETALING JAYA, MALAYSIA

Petaling Jaya, commonly called “PJ” by the locals, is a city in Petaling District, in the state of Selangor, Malaysia. Originally developed as a satellite township for Kuala Lumpur, the capital of Malaysia, it is part of the Greater Kuala Lumpur area.

  • Number of Airbnb listings: 945
  • Number of VRBO listings: 74
  • Average Occupancy Rate: 23% 
  • Average Nightly Rate: $53
  • Annual Revenue: $4,872
  • International Traveller Ratio: 33% 
  • Biggest traveller’s origin: Australia
  • Biggest domestic traveller’s origin: Kuala Lumpur
  • Most common guests’ language: English
  • Peak season: January
airbnb occupancy rates by city
PHILADELPHIA, USA

Philadelphia is the largest city in the Commonwealth of Pennsylvania in the United States. Philadelphia is most famous for the Liberty Bell, Rocky, cheesesteaks, and the Mummers. Additionally, it is known for its revolutionary history in general.

  • Number of Airbnb listings: 4,476
  • Number of VRBO listings: 1,014
  • Average Occupancy Rate: 47
  • Average Nightly Rate: $157
  • Annual Revenue: $31,392
  • International Traveller Ratio: 16% 
  • Biggest traveller’s origin: Canada
  • Biggest domestic traveller’s origin: Philadelphia
  • Most common guests’ language: English
  • Peak season: July – September
Phoenix AZ
PHOENIX, ARIZONA

Phoenix was established as an agricultural community near the confluence of the Salt and Gila Rivers in 1867, and it became a city in 1881. It is located in the Sonoran Desert’s northeastern reaches and has a hot desert climate.

  • Number of Airbnb listings: 4,614
  • Number of VRBO listings: 1,930
  • Average Occupancy Rate: 52% 
  • Average Nightly Rate: $149
  • Annual Revenue: $33,636
  • International Traveller Ratio: 12% 
  • Biggest traveller’s origin: Canada
  • Biggest domestic traveller’s origin: Phoenix
  • Most common guests’ language: English
  • Peak season: February
airbnb occupancy rates by city
PORTLAND, OREGON

Portland, Oregon, is a vibrant and scenic city in the USA’s Pacific Northwest. The largest city in the state, it’s famed for its huge expanses of green space, from parks and forests to breathtaking mountaintops.

  • Number of Airbnb listings: 3,342
  • Number of VRBO listings: 371
  • Average Occupancy Rate: 60
  • Average Nightly Rate: $124
  • Annual Revenue: $33,348
  • International Traveller Ratio: 12% 
  • Biggest traveller’s origin: Canada
  • Biggest domestic traveller’s origin: Seattle
  • Most common guests’ language: English
  • Peak season: July – August
Porto Portugal
PORTO, PORTUGAL

World-famous for its port wine, Porto is Portugal’s second largest city and is the commercial and industrial centre for the zone north of the Mondego River. Porto or Oporto is the second-largest city in Portugal, the capital of the Porto District, and one of the Iberian Peninsula’s major urban areas.

  • Number of Airbnb listings: 5,958
  • Number of VRBO listings: 701
  • Average Occupancy Rate: 42% 
  • Average Nightly Rate: $88
  • Annual Revenue: $15,012
  • International Traveller Ratio: 88% 
  • Biggest traveller’s origin: France
  • Biggest domestic traveller’s origin: London
  • Most common guests’ language: English
  • Peak season: August – September
airbnb occupancy rates by city
QUEENS, NEW YORK

Queens is a borough of New York City, coextensive with Queens County, in the U.S. state of New York. Located on Long Island, it is the largest borough of New York City in the area and it is bordered by the borough of Brooklyn at the western tip of Long Island to its west.

  • Number of Airbnb listings: 3,564
  • Number of VRBO listings: 57
  • Average Occupancy Rate: 47
  • Average Nightly Rate: $144
  • Annual Revenue: $29,628
  • International Traveller Ratio: 50% 
  • Biggest traveller’s origin: Canada
  • Biggest domestic traveller’s origin: New York City
  • Most common guests’ language: English
  • Peak season: August – September
airbnb occupancy rates by city
QUEZON CITY, PHILIPPINES

Quezon is the largest province in the CALABARZON region and is primarily agricultural in nature. The city is located immediately northeast of Manila, in central Luzon. Named for President Manuel Luis Quezon, who selected the site (formerly a private estate) in 1939, it officially replaced Manila as the capital in 1948.

  • Number of Airbnb listings: 1,171
  • Number of VRBO listings: 56
  • Average Occupancy Rate: 18% 
  • Average Nightly Rate: $58
  • Annual Revenue: $4,104
  • International Traveller Ratio: 50% 
  • Biggest traveller’s origin: USA
  • Biggest domestic traveller’s origin: Quezon City
  • Most common guests’ language: English
  • Peak season: January – February
Quito Ecuador
QUITO, ECUADOR

Quito is located in the northern highlands of Ecuador in the Guayllabamba river basin. The city is built on a long plateau lying on the east flanks of the Pichincha volcano. The valley of Guayllabamba River where Quito lies is flanked by volcanoes.

  • Number of Airbnb listings: 6,134
  • Number of VRBO listings: 264
  • Average Occupancy Rate: 32
  • Average Nightly Rate: $50
  • Annual Revenue: $6,612
  • International Traveller Ratio: 86% 
  • Biggest traveller’s origin: USA
  • Biggest domestic traveller’s origin: Quito
  • Most common guests’ language: Spanish
  • Peak season: February
airbnb occupancy rates by city
RICHMOND, CANADA

Richmond is a coastal city in the Lower Mainland region of British Columbia, Canada. It occupies almost the entirety of Lulu Island (not including Queensborough), between the two estuarine distributaries of the Fraser River.

  • Number of Airbnb listings: 954
  • Number of VRBO listings: 84
  • Average Occupancy Rate: 48% 
  • Average Nightly Rate: $116
  • Annual Revenue: $24,276
  • International Traveller Ratio: 50% 
  • Biggest traveller’s origin: USA
  • Biggest domestic traveller’s origin: Victoria
  • Most common guests’ language: English
  • Peak season: August
airbnb occupancy rates by city
ROME, ITALY

Rome, the Eternal City, is the capital and largest city of Italy and of the Lazio region. It is famous for being the home of the ancient Roman Empire, the Seven Hills, La Dolce Vita (the sweet life), the Vatican City, and Three Coins in the Fountain.

  • Number of Airbnb listings: 8,950
  • Number of VRBO listings: 3,014
  • Average Occupancy Rate: 45
  • Average Nightly Rate: $127
  • Annual Revenue: $23,796
  • International Traveller Ratio: 86% 
  • Biggest traveller’s origin: USA
  • Biggest domestic traveller’s origin: Paris
  • Most common guests’ language: English
  • Peak season: September – October
San Antonio
SAN ANTONIO, TEXAS

San Antonio, TX, is known for being the seventh-largest city in America. It’s a popular tourist destination known for famous locations like the Alamo, Sea World, and The San Antonio Botanical Garden.

  • Number of Airbnb listings: 3,525
  • Number of VRBO listings: 1,004
  • Average Occupancy Rate: 51% 
  • Average Nightly Rate: $108
  • Annual Revenue: $24,720
  • International Traveller Ratio: 8% 
  • Biggest traveller’s origin: Mexico
  • Biggest domestic traveller’s origin: Houston
  • Most common guests’ language: English
  • Peak season: June – July
airbnb occupancy rates by city
SAN DIEGO, CALIFORNIA

Located on the coast of the Pacific Ocean in Southern California, San Diego is widely known as “America’s Finest City.” Famous for its miles and miles of white-sand beaches and amazing weather, the city offers an abundance of fun attractions for visitors of all ages.

  • Number of Airbnb listings: 13,279
  • Number of VRBO listings: 6,000
  • Average Occupancy Rate: 63
  • Average Nightly Rate: $198
  • Annual Revenue: $53,724
  • International Traveller Ratio: 14% 
  • Biggest traveller’s origin: Mexico
  • Biggest domestic traveller’s origin: San Diego
  • Most common guests’ language: English
  • Peak season: August
San Francisco
SAN FRANCISCO, CALIFORNIA

San Francisco, city and port, coextensive with San Francisco county, northern California, U.S., located on a peninsula between the Pacific Ocean and San Francisco Bay. It is a cultural and financial centre of the western United States and one of the country’s most cosmopolitan cities.

  • Number of Airbnb listings: 4,777
  • Number of VRBO listings: 658
  • Average Occupancy Rate: 53% 
  • Average Nightly Rate: $192
  • Annual Revenue: $45,888
  • International Traveller Ratio: 29% 
  • Biggest traveller’s origin: UK
  • Biggest domestic traveller’s origin: New York
  • Most common guests’ language: English
  • Peak season: July – September
SAN JOSÉ, COSTA RICA

San José is the capital and largest city of Costa Rica, and the capital of the province of the same name. It is in the center of the country, in the mid-west of the Central Valley, within San José Canton.

  • Number of Airbnb listings: 3,851
  • Number of VRBO listings: 255
  • Average Occupancy Rate: 36
  • Average Nightly Rate: $67
  • Annual Revenue: $9,984
  • International Traveller Ratio: 75% 
  • Biggest traveller’s origin: USA
  • Biggest domestic traveller’s origin: San José
  • Most common guests’ language: English
  • Peak season: February
San Juan
SAN JUAN, PUERTO RICO

San Juan, capital and largest city of Puerto Rico, located on the northern coast of the island, on the Atlantic Ocean. A major port and tourist resort of the West Indies, it is the oldest city now under U.S. jurisdiction.

  • Number of Airbnb listings: 23
  • Number of VRBO listings: 1,404
  • Average Occupancy Rate: 61% 
  • Average Nightly Rate: $178
  • Annual Revenue: $45,576
  • International Traveller Ratio: 8% 
  • Biggest traveller’s origin: Puerto Rico
  • Biggest domestic traveller’s origin: New York
  • Most common guests’ language: English
  • Peak season: August
airbnb occupancy rates by city
SAINT PETERSBURG, RUSSIA

St. Petersburg is a mecca of cultural, historical, and architectural landmarks. Founded by Tsar Peter I (the Great) as Russia’s “window on Europe,” it bears the unofficial status of Russia’s cultural capital and most European city, a distinction that it strives to retain in its perennial competition with Moscow.

  • Number of Airbnb listings: 15,915
  • Number of VRBO listings: 553
  • Average Occupancy Rate: 39
  • Average Nightly Rate: $61
  • Annual Revenue: $9,000
  • International Traveller Ratio: 33% 
  • Biggest traveller’s origin: USA
  • Biggest domestic traveller’s origin: Moscow
  • Most common guests’ language: Russian
  • Peak season: June
airbnb occupancy rates by city
SANTIAGO, CHILE

Santiago has been the capital city of Chile since colonial times. The city has a downtown core of 19th-century neoclassical architecture and winding side-streets, dotted by art deco, neo-gothic, and other styles.

  • Number of Airbnb listings: 3,932
  • Number of VRBO listings: 228
  • Average Occupancy Rate: 37% 
  • Average Nightly Rate: $57
  • Annual Revenue: $9,204
  • International Traveller Ratio: 67% 
  • Biggest traveller’s origin: Brazil
  • Biggest domestic traveller’s origin: Santiago
  • Most common guests’ language: Spanish
  • Peak season: February
Santo Domingo
SANTO DOMINGO, DOMINICAN REPUBLIC

Santo Domingo is the capital of the Dominican Republic. It is situated on the southeast coast of the island of Hispaniola, at the mouth of the Ozama River, and is the oldest permanent city established by Europeans in the Western Hemisphere. 

  • Number of Airbnb listings: 4,664
  • Number of VRBO listings: 412
  • Average Occupancy Rate: 38
  • Average Nightly Rate: $63
  • Annual Revenue: $10,104
  • International Traveller Ratio: 90% 
  • Biggest traveller’s origin: USA
  • Biggest domestic traveller’s origin: New York
  • Most common guests’ language: English
  • Peak season: February
airbnb occupancy rates by city
SCOTTSDALE, ARIZONA

Scottsdale, Arizona is located in the beautiful Sonoran Desert at the foot of the scenic McDowell Mountains. It is bordered by Phoenix to the West, the Tonto National Forrest to the North, the McDowell Mountains to the East, and the Salt River to the South.

  • Number of Airbnb listings: 3,262
  • Number of VRBO listings: 2,251
  • Average Occupancy Rate: 49% 
  • Average Nightly Rate: $171
  • Annual Revenue: $38,172
  • International Traveller Ratio: 6% 
  • Biggest traveller’s origin: Canada
  • Biggest domestic traveller’s origin: Phoenix
  • Most common guests’ language: English
  • Peak season: February – March
SEATTLE, WASHINGTON

Seattle is a bustling place that thrives with industrial, commercial, and cultural activity around the clock. Its waters teem with great oceangoing ships, streets with automobiles, rail lines with transcontinental freighters and passenger trains, and skies with aircraft of every description.

  • Number of Airbnb listings: 4,050
  • Number of VRBO listings: 560
  • Average Occupancy Rate: 59
  • Average Nightly Rate: $139
  • Annual Revenue: $37,356
  • International Traveller Ratio: 11% 
  • Biggest traveller’s origin: Canada
  • Biggest domestic traveller’s origin: Seattle
  • Most common guests’ language: English
  • Peak season: July – August
airbnb occupancy rates by city
SEVILLA, SPAIN

An inland port, it is the chief city of Andalusia and the fourth largest in Spain. Sevilla was important in history as a cultural centre located on the Guadalquivir River, it is Spain’s leading inland port.

  • Number of Airbnb listings: 4,700
  • Number of VRBO listings: 1,265
  • Average Occupancy Rate: 45% 
  • Average Nightly Rate: $134
  • Annual Revenue: $23,844
  • International Traveller Ratio: 75% 
  • Biggest traveller’s origin: France
  • Biggest domestic traveller’s origin: Madrid
  • Most common guests’ language: English
  • Peak season: October – November
Singapore City
SINGAPORE CITY, SINGAPORE

Singapore is a sunny, tropical island in South-east Asia, off the southern tip of the Malay Peninsula. The city-state is 710 square kilometres and inhabited by five million people from four major communities; Chinese (majority), Malay, Indian and Eurasian.

  • Number of Airbnb listings: 2,596
  • Number of VRBO listings: 771
  • Average Occupancy Rate: 31
  • Average Nightly Rate: $156
  • Annual Revenue: $19,572
  • International Traveller Ratio: 4% 
  • Biggest traveller’s origin: USA
  • Biggest domestic traveller’s origin: Kuala Lumpur
  • Most common guests’ language: English
  • Peak season: December
Split Croatia
SPLIT, CROATIA

Split is the second largest city of Croatia, the largest city in the region of Dalmatia and the largest city on the Adriatic coast of Croatia.

  • Number of Airbnb listings: 5,291
  • Number of VRBO listings: 1,317
  • Average Occupancy Rate: 33% 
  • Average Nightly Rate: $107
  • Annual Revenue: $13,752
  • International Traveller Ratio: 50% 
  • Biggest traveller’s origin: USA
  • Biggest domestic traveller’s origin: London
  • Most common guests’ language: English
  • Peak season: March
airbnb occupancy rates by city
TBILISI, GEORGIA

Tbilisi, the capital of Georgia is one of the safest cities in Europe. With its love for food and wine, Georgia has a similar vibe to Italy but is more affordable. 

  • Number of Airbnb listings: 7,715
  • Number of VRBO listings: 815
  • Average Occupancy Rate: 36% 
  • Average Nightly Rate: $42
  • Annual Revenue: $6,300
  • International Traveller Ratio: 97% 
  • Biggest traveller’s origin: Russia
  • Biggest domestic traveller’s origin: Moscow
  • Most common guests’ language: English
  • Peak season: September
Tel Aviv
TEL-AVIV YAFO, ISRAEL

Tel Aviv-Yafo often referred to as just Tel Aviv, is the most populous city in the Gush Dan metropolitan area of Israel. By the beginning of the 21st century the modern city of Tel Aviv had developed into a major economic and cultural centre.

  • Number of Airbnb listings: 5,363
  • Number of VRBO listings: 1,008
  • Average Occupancy Rate: 36% 
  • Average Nightly Rate: $216
  • Annual Revenue: $32,352
  • International Traveller Ratio: 90% 
  • Biggest traveller’s origin: USA
  • Biggest domestic traveller’s origin: New York
  • Most common guests’ language: English
  • Peak season: July – August
airbnb occupancy rates by city
TORONTO, CANADA

Toronto is Canada’s largest city and a world leader in such areas as business, finance, technology, entertainment and culture. Its large population of immigrants from all over the globe has also made Toronto one of the most multicultural cities in the world.

  • Number of Airbnb listings: 3,144
  • Number of VRBO listings: 178
  • Average Occupancy Rate: 41% 
  • Average Nightly Rate: $149
  • Annual Revenue: $26,244
  • International Traveller Ratio: 100% 
  • Biggest traveller’s origin: USA
  • Biggest domestic traveller’s origin: Toronto
  • Most common guests’ language: English
  • Peak season: August – September
airbnb occupancy rates by city
TOULOUSE, FRANCE

Toulouse is a city in southwestern France, near the Pyrenees, in the Midi-Pyrenees region, halfway between the Atlantic and the Mediterranean. Toulouse is the fourth largest city in France, after Paris, Marseille, and Lyon, and is renowned as a city of rugby and violets.

  • Number of Airbnb listings: 2,292
  • Number of VRBO listings: 444
  • Average Occupancy Rate: 45
  • Average Nightly Rate: $79
  • Annual Revenue: $15,348
  • International Traveller Ratio: 42% 
  • Biggest traveller’s origin: Spain
  • Biggest domestic traveller’s origin: Paris
  • Most common guests’ language: French
  • Peak season: September
airbnb occupancy rates by city
UBUD, INDONESIA

Ubud is a town on the Indonesian island of Bali in Ubud District, located amongst rice paddies and steep ravines in the central foothills of the Gianyar regency. It is also known as Bali’s art and culture capital.

  • Number of Airbnb listings: 3,530
  • Number of VRBO listings: 412
  • Average Occupancy Rate: 23% 
  • Average Nightly Rate: $68
  • Annual Revenue: $6,180
  • International Traveller Ratio: 50% 
  • Biggest traveller’s origin: USA
  • Biggest domestic traveller’s origin: London
  • Most common guests’ language: English
  • Peak season: March
Valencia ESP
VALENCIA, SPAIN

Valencia is Spain’s third-largest metropolitan area, with a population ranging from 1.7 to 2.5 million depending on how the metropolitan area is defined. The Port of Valencia is the 5th-busiest container port in Europe and the busiest container port on the Mediterranean Sea.

  • Number of Airbnb listings: 4,882
  • Number of VRBO listings: 855
  • Average Occupancy Rate: 54
  • Average Nightly Rate: $99
  • Annual Revenue: $22,212
  • International Traveller Ratio: 21% 
  • Biggest traveller’s origin: UK
  • Biggest domestic traveller’s origin: Madrid
  • Most common guests’ language: English
  • Peak season: July – August
airbnb occupancy rates by city
VANCOUVER, CANADA

The City of Vancouver is a coastal, seaport city on the mainland of British Columbia. Located on the western half of the Burrard Peninsula, Vancouver is bounded to the north by English Bay and the Burrard Inlet and to the south by the Fraser River.

  • Number of Airbnb listings: 3,077
  • Number of VRBO listings: 522
  • Average Occupancy Rate: 51% 
  • Average Nightly Rate: $124
  • Annual Revenue: $28,188
  • International Traveller Ratio: 83% 
  • Biggest traveller’s origin: USA
  • Biggest domestic traveller’s origin: Vancouver
  • Most common guests’ language: English
  • Peak season: August – September
Venice IT
VENICE, ITALY

Venice, known also as the “City of Canals,” “The Floating City,” and “Serenissima,” is arguably one of Italy’s most picturesque cities. With its winding canals, striking architecture, and beautiful bridges, Venice is a popular destination for travel.

  • Number of Airbnb listings: 5,253
  • Number of VRBO listings: 1,909
  • Average Occupancy Rate: 38
  • Average Nightly Rate: $178
  • Annual Revenue: $27,684
  • International Traveller Ratio: 77% 
  • Biggest traveller’s origin: USA
  • Biggest domestic traveller’s origin: London
  • Most common guests’ language: English
  • Peak season: August – September
airbnb occupancy rates by city
VIENNA, AUSTRIA

Vienna, also described as Europe’s cultural capital, is a metropolis with unique charm, vibrancy and flair. It boasts outstanding infrastructure, is clean and safe, and has all the inspiration that you could wish for in order to discover this wonderful part of Europe.

  • Number of Airbnb listings: 3,266
  • Number of VRBO listings: 632
  • Average Occupancy Rate: 42% 
  • Average Nightly Rate: $57
  • Annual Revenue: $18,636
  • International Traveller Ratio: 80% 
  • Biggest traveller’s origin: Germany
  • Biggest domestic traveller’s origin: Vienna
  • Most common guests’ language: English
  • Peak season: September
airbnb occupancy rates by city
WARSAW, POLAND

Warsaw, Polish Warszawa, city, capital of Poland. Located in the east-central part of the country, Warsaw is also the capital of Mazowieckie województwo (province). Warsaw is notable among Europe’s capital cities not for its size, its age, or its beauty but for its indestructibility.

  • Number of Airbnb listings: 5,040
  • Number of VRBO listings: 713
  • Average Occupancy Rate: 43
  • Average Nightly Rate: $57
  • Annual Revenue: $10,176
  • International Traveller Ratio: 86% 
  • Biggest traveller’s origin: USA
  • Biggest domestic traveller’s origin: Warsaw
  • Most common guests’ language: English
  • Peak season: September
Washington dc
WASHINGTON, USA

Washington, constituent state of the United States of America, lies at the northwestern corner of the 48 conterminous states. It is bounded by the Canadian province of British Columbia to the north, the U.S. states of Idaho to the east and Oregon to the south, and the Pacific Ocean to the west.

  • Number of Airbnb listings: 4,862
  • Number of VRBO listings: 919
  • Average Occupancy Rate: 49% 
  • Average Nightly Rate: $154
  • Annual Revenue: $33,444
  • International Traveller Ratio: 12% 
  • Biggest traveller’s origin: UK
  • Biggest domestic traveller’s origin: New York
  • Most common guests’ language: English
  • Peak season: July

CONCLUSION

Since Airbnb is rapidly increasing and constantly changing for each city in the world, it is crucial to make decisions based on wild guesses. The data points mentioned in this article such as Airbnb occupancy rates per city, annual revenue, & traveller’s ratio should be your basis for improving your properties.

Hence, if the data presented above has given you ideas to boost your strategic pricing plan for your business, then an Airbnb calculator is certainly what you need for success in the long run. It’s a fact that some of the STR investors are also considering Airbnb Rental Arbitrage, but they still need to have a reliable data tool to base their conclusions on!

As we live in a digital era, an accurate data analytics tool can help your business stand out among your surrounding competitors and benchmark your property by tracking the occupancy rates of competing listings in your preferred city.

Now that you have a brief background of the average figures for each major city in the world, don’t miss out on tremendous opportunities! With the help of our all-in-one analytics service, you can vastly enhance your monthly revenue, create a comparison for each neighborhood, add the appropriate amenities and so many more exciting features. 

Categories
Airbnb Occupancy All About Airbnb

Airbnb Occupancy Rates in Canada + Best Cities for Investment in 2022

Are you planning to start an Airbnb business with a breathtaking view of the Northern lights? Canada is the best place to do so!

Located on the North American continent, Canada is certainly a fascinating country that offers more than just maple syrup! This country has the longest coastline in the entire world and is home to the magical Niagara Falls. One of the things that Canada is famous for is its national dish ‘poutine’ – which is a perfect match with their very own craft beer!

Canada was recognized for its record-breaking year with a total number of 22.1 million travelers in 2019, however, just like many other countries around the globe, was vastly affected by the pandemic. According to Statistics Canada, the easing of travel restrictions in July 2021 has tremendously improved the overall tourism in the country.

In this article, we will talk more about the Airbnb occupancy rates & monthly revenue in the beautiful country of Canada and compare each city! We will also give some recommendations of the best cities & neighborhoods that are worth investing in. Let’s dive in!

Occupancy Rates & Average Monthly Revenue (CAD) in Canadian Cities
Frequently Asked Questions

Yes, it is mostly legal with strict compliance with tax, rules, and regulations. Learn more about Airbnb rules in Canada here.

Typically, the months of July to August are the peak seasons in Canada with an average of 46% occupancy rate.

According to Airbtics' Data, the average daily rate in Canada is CAD$113 for studio-type rooms.

As of April 2022, the city of Vancouver has the highest occupancy rate at 54%.

Based on our in-depth research, if you are looking forward to maximizing your monthly revenue in Canada, Vancouver is ranked 1st on our list.


Aside from its high occupancy rate of 54%, you can also set a price as cheap as CAD$119 & earn an average of CAD$2,268 per month!

According to Airbnb, here are some of the popular amenities that you might want to consider having in your business in Canada:

- An outdoor pool

- Pet-friendly environment

- Free parking on premises

- Fully-equipped kitchen

- Reliable Wi-Fi

- Air conditioning

Not satisfied with this list? Check out these top amenities that all Airbnb hosts must have this 2022!

Yes, a business license is required for all short-term rental operators in Canada.

Since there are various local regulations such as business permits required for each city, here are the following short-term regulations in each Canadian city:

You can report your rental income by using the Form T776 (Statement of Real Estate Rentals) and make sure to have a detailed record of your rental expenses for the tax return.

The Canada Revenue Agency (CRA) states the rule of thumb that the more services you provide, the greater chance that your rental services will be considered a business.

According to our Airbnb calculator, the city of Vancouver has the highest occupancy rates in Canada and an Airbnb host can make an annual revenue of CAD$2,268.

canada cities airbnb monthly revenue

Presented in the photo above is a general overview of the average monthly revenue of the 5 cities in Canada as of April 2022.

We utilized the Airbtics data analytics tool and filtered the listings in studio-type rooms in order to come up with accurate data of the respective cities in Canada. Check out the following rates in the biggest cities of the Great White North:

Toronto, Ontario:

Occupancy Rate: 44%

Median Daily Rate: C$122

Average Monthly Revenue: C$1,902

Quebec City, Quebec:

Occupancy Rate: 41%

Median Daily Rate: C$123

Average Monthly Revenue: C$1,652

Vancouver, British Columbia:

Occupancy Rate: 54%

Median Daily Rate: C$119

Average Monthly Revenue: C$2,268

Calgary, Alberta:

Occupancy Rate: 46%

Median Daily Rate: C$110

Average Monthly Revenue: C$1,657

Ottawa, Ontario:

Occupancy Rate: 46%

Median Daily Rate: C$90

Average Monthly Revenue: $1,349

how much can you make on airbnb

Best 5 Cities & Neighborhoods in Canada for Airbnb Investment

airbnb occupancy rates in canada
Toronto, Ontario

Found on the northwest side of Lake Ontario, the mesmerizing city of Toronto is the capital of Ontario province. This city is known for its multiculturalism, unique landmarks, sports & music scenes, and is also home to one of the world’s largest film festivals!

While there are plenty of best things to do in Toronto, it’s also important to take note that this city is the leading tourism destination in Canada with over 27.5 million visitors annually! From a unique experience of viewing the CN Tower, to going back to a medieval feels of Casa Loma, or dining in the Entertainment district — Toronto has a lot to offer to all kinds of tourists, whatever the season may be.

In addition to this, here are some of the best neighborhoods that you might consider investing in Toronto:

For shopping & dining – Dundas and Spadina

For nightlife & entertainment: Entertainment District

For travelers with families: Rockcliffe-Smythe

For LGBT Community: The Village

QUEBEC CITY, QUEBEC
airbnb occupancy rates in canada

If you’re looking for a glimpse of Europe in Canada, Québec City is the missing piece of the puzzle!

Known for its European architecture, the majority of people in this city are French speakers. Some of the best tourist attractions in Québec City include Mont-Tremblant where you can have an extraordinary skiing experience, visit the tourist central & dine in one of the tasty restaurants in Palace Royal, and catch symphony performances at Grand Théâtre near the Parliament Building.

The tourism operators in Québec City reported great news in 2021 that it exceeded their expectations: 60-70% hotel occupancy rates and 100% restaurant occupancy rates! With the historic district for Old Québec declared as a UNESCO world heritage site, this city is undoubtedly attracting more and more tourists annually. Furthermore, let’s discuss the compelling neighborhoods in Québec:

For nightlife & entertainment: Saint-Jean-Baptiste

For art, music, theatre & film enthusiasts: Montcalm

For travelers with families: Limoilou

For student travelers / historians: Old Québec

vancouver, british columbia

Situated on a peninsula in the Strait of Georgia, Vancouver was ranked 3rd as the most livable place in the world because of its high standard of living & quality of life! Filled with nature’s wonders and busy cultural life, this city has a handful of exciting things to offer.

To name a few beautiful must-see places in Vancouver, Stanley Park is famous for its closeness to nature, outdoor activities & breathtaking sceneries. Next to this is the beautiful Granville Island which is considered the thriving center of activity, and of course, shopping in the public market! Vancouver’s Tourism Industry stated that tourism contributes over $14 billion in total revenues to the Metro Vancouver economy annually. Without a doubt, this city ranked 1st on our list with the highest occupancy rate of 54% because of its endless wonders!

Check out the following list of neighborhoods which will serve as your guide for running an Airbnb business in Vancouver:

For sightseeing: Vancouver South

For business travelers: Downtown

For travelers with families: West End

For beachfront areas & outdoor recreation: Kitsilano

For nightlife & bars: Coal Harbour

CALGARY, ALBERTA
calgary

As the financial centre of western Canada, Calgary plays a vital role in the development of the region’s gas & oil industry. Located in Southern Alberta, this city is famous for hosting the Calgary Stampede every year of July which usually has over 90% of hotel occupancy rates! Because of its excellent outdoor festivals and close proximity to the mountains, this city attracts over 7.7 million from around the globe annually.

Aside from visiting the 10-day Calgary Stampede, there are so many amazing things you can explore in Calgary! You can spend an entire day in Banff National Park, take the Rocky Mountaineer Rail tour, or visit a few of the remarkable urban parks including Bowness & Fish Creek Provincial Parks. With a similar occupancy rate as Ottawa of 46%, Airbnb hosts can earn an average of CAD$1,657 in Calgary.

Here are some of the neighborhoods that are worth investing in according to your preference:

For travelers with families & sightseeing: Downtown

For nightlife & entertainment: 17th Avenue

For outdoor experience: Kananaskis Country

airbnb occupancy rates in canada
ottawa, Ontario

Branded as the UNESCO City of Design, Ottawa is Canada’s capital city!

Ottawa’s Tourism Industry recorded this city as a top national destination for Canadian & international associations with 26 major events hosted this 2022. The majority of tourists are stoked to visit the iconic landmarks in Ottawa including Parliament Hill, Rideau Canal for a magical cruise trip, and visit the Notre-Dame Cathedral or Canadian Museum of Nature!

In addition to this, since Ottawa is an employer of choice and has the lead in domestic market share growth, it has increased the number of visitors and has grown its international & domestic market share this 2022. Finally, let us go through the most recommended neighborhoods in Ottawa and classify them accordingly:

For shopping: Kanata & Glebe

For travelers with families: Westboro

For night clubs & restaurants: ByWard Market

looking for more canadian cities?

If you are looking for other Canadian cities, check out the other best cities to invest in real estate in Canada and find out more!

airbnb occupancy rates in canada

After in-depth research about Canada’s Airbnb occupancy rates, we have come to the conclusion that Airbnb is certainly profitable in this country. As long as you have the resources, rates for comparison, and the drive to run an Airbnb business in this beautiful country – you’re almost there and set to start!

Now that you have insight and data on the major cities in Canada for studio-type bedrooms, don’t get settled just yet because there’s a long way to go. Fortunately, for hosts like you, we have a reliable data analytics tool that can help you figure out a strategy for your Airbnb business! If you will base your assumptions on articles portraying poorly estimated costs or a wild guess, then you will certainly find inaccurate results. 

With the help of our all-in-one analytics service, you can vastly enhance your monthly revenue, create a comparison for each neighborhood, add the appropriate amenities and so many more exciting features. Try Airbtics now and stand out among your competitors!

Categories
Airbnb Occupancy All About Airbnb

Airbnb Occupancy Rates in Mexico + Top 5 Cities & Neighborhoods!

Are you looking forward to investing in an Airbnb business in a country with the sweetest Caribbean climate? MEXICO!

You may have heard about this country’s tasty authentic Mexican cuisine and numerous historical culture, but there’s just so much more to know! Aside from the fact that Aztec & Mayan sites have been declared UNESCO World Heritage sites, you can also find the most exciting top tourist attractions in Mexico to add these in your travel bucket list!

Popular for its strong indigenous heritage, Mexico also offers a vibrant modern culture filled with history, art, religion & film!  The recent Tourism in Mexico has declared a total number of $35 million international visitors in 2021 & a 56% average occupancy rate in one of their biggest cities. 

In this article, we will compare the occupancy rates in the biggest Mexican cities and discuss the endless possibilities & reasons why Mexico might be the perfect place to start an Airbnb business. Without further ado, let’s dive in!

mexico cities occupancy rates
mexican cities airbnb daily rates 2022

Here is a general overview of the median daily rate of the 5 cities in Mexico in April 2022.

In order to come up with accurate data of the respective cities in Mexico, we utilized the Airbtics data analytics tool and filtered the listings into 1 bed / 1 bath Apartment (Condo). Check out the following rates in the biggest cities in Mexico:

Ciudad de México:

Occupancy Rate: 44%

Median Daily Rate: $68

Average Monthly Revenue: $935

Oaxaca:

Occupancy Rate: 43%

Median Daily Rate: $49

Average Monthly Revenue: $680

Guadalajara:

Occupancy Rate: 42%

Median Daily Rate: $47

Average Monthly Revenue: $643

Puebla:

Occupancy Rate: 30%

Median Daily Rate: $44

Average Monthly Revenue: $364

Cancún:

Occupancy Rate: 47%

Median Daily Rate: $79

Average Monthly Revenue: $1,172

Frequently Asked Questions

Yes, Airbnb is legal in Mexico - with strict compliance to rules & regulations. Although the Mexican government is generally open to foreign portfolio investments, there are also restrictions on foreign investments in Mexico.

Typically, the months of September to November are the peak seasons in Mexico with an average of 53% occupancy rate.

According to Airbtics' Data, the average daily rate in Mexico City is $68 for 1 bed / 1 bath apartment (condo) & $59 for studio-type rooms.

As of April 2022, the city of Cancún has the highest occupancy rate of 47%.

Based on our in-depth research, if you are looking forward to maximizing your monthly revenue in Mexico, the city of Cancún is ranked 1st on our list. Aside from its high occupancy rate of 47%, you can also earn an average of $1,172 per month!

According to Airbnb, here are some of the popular amenities that you might want to consider having in your business:

- Fully-equipped kitchen

- Reliable Wi-Fi

- An outdoor pool

- Free parking on premises

- Air conditioning

If you're looking for a more detailed description of Airbnb amenities, check out the top amenities that all Airbnb hosts must have this 2022!

Unfortunately, yes,  you have to. Although property taxes in Mexico vary throughout the country, you are required to pay property taxes if:

-  you own a property in Mexico;

- earn an income from renting your home to others;

- and if you are selling your investment property in Mexico.

RFC  - also known as the Registro Federal de Contribuyentes, is a Mexican tax ID number that is required for foreign investors. According to Mexico Newsletter, you will be taxed 20% if you don't have an RFC but you can apply for this without the need of becoming a resident of Mexico.

If you have already registered for Servicio de Administración Tributaria (SAT) to pay for your income taxes in Mexico, you have to submit your annual tax return by April 30th of the following year.

Learn more about the requirements for Mexico Airbnb hosts here.

To comply with your tax obligations, here are the five steps that you have to follow:

  1. Register as a taxpayer before the SAT & process your RFC.
  2. Update your economic activities & tax obligations in the RFC.
  3. Select your preferred taxation method.
  4. Register your RFC on the Airbnb platform.
  5. Fulfill your obligations to declare, issue invoices & keep accounts.

And voila! You can also learn more information about this on the Airbnb Tax Resource Center in Mexico.

According to our Airbtics calculator, the city of Cancún has the highest occupancy rates in Mexico and an Airbnb host can make an annual revenue of $14,052.

how much can you make on airbnb

Top 5 Cities in Mexico & Most Recommended Neighborhoods

Ciudad de México

One of the most interesting facts about Mexico City is that it was built on an artificial island in the middle of the lake, therefore, it is sinking every year because of a phenomenon called ‘subsidence’. The tourism statistics in Mexico stated that Mexico City has recorded a remarkable surge of tourists arrivals in 2021.

From strolling through the city’s historic center, you can also see Frida Kahlo’s house & museum, visit some of the iconic churches like the cathedral Metropolitana, take photos at the Chapultepec Castle and taste the authentic Mexican food, of course!

While there are a lot of exciting things to do in Mexico City, here are some of the most recommended neighborhoods that you can consider investing in:

  • For sightseeing & budget travelers: Historic Centre
  • For bohemian & artsy travelers: Condesa
  • For luxurious & exclusive neighborhood: Polanco
mexico city airbnb
  • For nightlife & most gay-friendly neighborhood: Zona Rosa
  • For first time visitors: Paseo de La Reforma
  • For modern areas & shopping: Santa Fe

Here are some of the best neighborhoods in Cancún that you might want to check out:

  • For sightseeing: Middle Hotel Zone, El Centro
  • For families: Riviera Cancún
  • For first-time visitors: North, Middle & South Hotel Zone
  • For an outdoor water experience: Punta Cancun

Cancún

The Acapulco of Mexico’s Gulf Coast, Cancún, is best-known for its white sand beaches and exciting nightlife. Because of its fascinating tourist experience, this city is also a known destination for university students during their spring break period.

Oh and let’s not forget the most important acknowledgement in Cancún City – it is the second most visited destination in the world for 2021!

Relatively, the Tourism officials in Quintana Roo have recorded over 12.5 million visitors in 2021 and are already expecting 6 million tourists in the first four months of 2022.

The majority of tourists can seize their travel by trying the best activities in Cancun such as snorkeling, tripping to Chichen Itza, visiting the Mayan Museum to learn about Mexico’s most treasured history, and so many more!

Oaxaca

If you’re looking for world-class cuisine in Mexico, you’re in luck! This particular city is best known as the gastronomic capital in Mexico with candy-colored buildings.

While food is being highly prioritized during trips, there are lots of fun things to do in Oaxaca such as visiting the Cultural Museum of Oaxaca, enjoying the festivals (Day of the Dead Celebration), and going shopping for souvenirs at the Mercado 20 de Noviembre!

Check out the following list of neighborhoods which will serve as your guide to the best ones in Oaxaca:

  • For exploring restaurants: La Noria
  • For nightlife: Santo Domingo
  • For first-time visitors: Centro
oaxaca mexico airbnb rates
mexico airbnb guadalajara occupancy rates

Let’s discuss the compelling neighborhoods of Guadalajara:

  • For sightseeing: Downtown or Tlaquepaque
  • For shopping: Downtown Mercado
  • For food and restaurants: Colonia Americana
  • For nightlife & music: Avenida Chapultepec & Zapopan

Guadalajara

This second-largest city in Mexico is the capital of the state of Jalisco, located in the western part of the country and is home to no other than – TEQUILA! 

With this city’s unique architecture and compelling activities, the top-rated tourist attractions in Guadalajara have increased their chances of being primed for a tourism boom.

While this city provides a rare European vibe, it is also a center of mariachi music, popular folk dance, and they have globally renowned cultural events such as international film festivals and book fairs. 

In addition to this, there are must-see places in Guadalajara for travelers with families. They can visit the famous Nuestros Dulces candy factory in Tlaquepaque, have outdoor activities at the ZooLogico Y Safari, or be thrilled with rides at Natural Adventure Fun park. 

puebla mexico 2022

Puebla

A viceregal-era planned city, Puebla is located in East-Central Mexico and it has the most magical towns that one shouldn’t miss!

Aside from their expertise in handicrafts and gastronomy, this city also offers its visitors to go back in time and see the old quarters of Puebla. Some of the best things to do in Puebla are riding the ferris wheel in Estrella de Puebla, traveling to grab drinks with friends in Barrio las Artistas, or joining a Lucha Libre (Mexican wrestling) tour!

Finally, here are some of the hot neighborhoods that you might want to consider for your business:

  • For sightseeing: Centro Historico
  • For nightlife: Colonia Lafayette
  • For travelers with families: Barrio Santa Teresita
  • For restaurants: Colonia San Francisco
Want to compare airbnb occupancy rates in other cities?

If you are looking for the necessary data in other cities, check out the Airbnb statistics including the highest occupancy rates!

airbnb mexico

In conclusion, Mexico has a wide variety of beautiful options in its cities for all kinds of travelers across the globe. During our in-depth research about the Airbnb occupancy rates in Mexican cities, we also discovered that there were certain listings (vacation rental homes, private rooms, etc) that portrayed the highest occupancy rates & annual revenue. 

Fortunately, for hosts like you, this shouldn’t be a difficult task if you have a reliable data analytics tool to help you figure out a strategy for your Airbnb business! If you will base your assumptions on articles portraying poorly estimated costs or a wild guess, then you will certainly find inaccurate results. Since you already have a broad perspective of occupancy rates for apartment types in the biggest Mexican cities this 2022, don’t settle!

With the help of our all-in-one analytics service, you can vastly enhance your monthly revenue, create a comparison for each neighborhood, add the appropriate amenities and so many more exciting features. Try Airbtics now and stand out among your competitors!

Categories
Airbnb Occupancy All About Airbnb

Comparison of Airbnb Occupancy Rates in the cities of Australia: Sydney, Melbourne, Perth & more!

Are you looking for a place that is a continent, a country, and an island at the same time?  Then Australia is definitely the answer! Located below the equator of the earth, Australia is also known as the ‘land down under’. Since the pandemic hit the globe, the number of Airbnb listings has declined due to the lockdowns and border closures in Australia. Despite the fact that there is a decrease in the overall total number of listings in this country, you’ll be surprised to know that NOT all Airbnb hosts were affected. Because of the consistent demand for rural getaways in Australia, the Airbnb property occupancy rates (particularly in Sydney & Melbourne) has increased from January to April 2021, according to Business Insider Australia.

Relatively, we managed to notice the comparison of the 2021 and 2022 Tourism statistics in Australia. Therefore, if you are wondering…   Is Airbnb profitable or a good investment in this country? If so, which city or neighborhood should I keep my eye on based on Airbnb statistics in Australia? Continue reading & find out what we discovered!

Occupancy Percentage & Annual Monthly Revenue in Australia
Frequently Asked Questions

Yes, Airbnb is legal in Australia - with strict compliance to local & state laws. If you are planning to start your Airbnb business under a lease agreement, then the first thing you have to do is to let have your landlord's consent.

Contrary to this, if you are a property owner, it is necessary to follow the steps for registration and pay the necessary fees.

Typically, the months of September to December are the peak seasons in Australia with an average of 59% occupancy rate.

According to Airbtics' Data, the average daily rate in Australia is A$398 for apartment (condo) & A$106 for studio-type rooms.

As of April 2022, both the cities of Darwin & Perth have the highest occupancy rate of 53%.

Based on Airbtics data, it's clear that Airbnb is profitable in Australia. To support this claim, The Australian Bureau of Statistics shows that both domestic and international tourism has rapidly increased this 2022. 

Based on our in-depth research, if you are looking forward to maximizing your monthly revenue in Australia, Darwin is ranked 1st on our list. Aside from its high occupancy rate of 53%, you can also earn an average of A$4,520 per month!

According to Airbnb, here are some of the popular amenities that you might want to consider having in your business:

- Fully-equipped kitchen

- Reliable Wi-Fi

- An outdoor pool

- Free parking on premises

- Air conditioning

If you're looking for a more detailed description of Airbnb amenities, check out the top amenities that all Airbnb hosts must have this 2022!

According to Book Kept, any income derived from rent will automatically be assessable income - therefore, yes it's taxable!

Learn more about tax deductions & accounting tips for Airbnb hosts here.

According to our Airbtics calculator, Perth & Darwin have the highest occupancy rates in Australia. Therefore, an Airbnb host can make an annual revenue of the following:

Perth: A$35,808

Darwin: A$57,720

Yes, an Airbnb host will need the approval of the local council and a licence to be registered as a Bed & Breakfast accommodation before formally operating. 

Here is a summary of the laws applicable to short-term lettings:

  1. Town Planning Law - explains the difference between renting out rooms in a home, flat, or whole apartment.
  2. Insurance Law - coverage for landlord's policies including host protection insurance & host guarantee.
  3. Taxation Law - these include capital gains tax, income tax, and Goods & Services Tax (GST). 
  4. Strata Law - prohibits any restrictions on an owner's right to rent out their strata apartment.
  5. Tenancy Law - prohibits tenants from sub-leasing the property without the landlord's consent.

Learn more about laws concerning short-term lettings in Australia.

Most of the major business taxes such as income tax from your revenue are collected by the Australian Government through ATO. Your own tax obligations may vary under certain circumstances, you can directly consult ATO or a tax professional.

Check out the tax considerations on short-term lettings in Australia.

australia occupancy rate

Here is a general overview of Australia’s occupancy percentage, median daily rate & average monthly revenue as of April 2022.

In order to come up with accurate data of the respective cities in Australia, we utilized the Airbtics data analytics tool and filtered the listings into 1 bed / 1 bath Apartment (Condo). Check out the following rates in the biggest cities in Australia:

Sydney:

Occupancy Rate: 39%

Median Daily Rate: A$267

Average Monthly Revenue: A$3,374

Melbourne:

Occupancy Rate: 38%

Median Daily Rate: A$199

Average Monthly Revenue: A$2,435

Brisbane:

Occupancy Rate: 48%

Median Daily Rate: A$201

Average Monthly Revenue: A$2,972

Adelaide:

Occupancy Rate: 47%

Median Daily Rate: A$195

Average Monthly Revenue: A$3,052

Perth:

Occupancy Rate: 53%

Median Daily Rate: A$143

Average Monthly Revenue: A$2,616

Darwin:

Occupancy Rate: 53%

Median Daily Rate: A$258

Average Monthly Revenue: A$4,520

how much can you make on airbnb
Sydney australia airbnb occupancy rates

Here are some of the most recommended neighborhoods in Sydney that you might want to consider:

  • For sightseeing: Circular Quay & The Rocks
  • For nightlife: Kingscross
  • For families & beachfront areas: Bondi & Manly
  • For first-time visitors: City Centre
  • For shopping: Darling Harbour

While this city has a lot of exciting activities to offer in general, you may also want to check out the rest of the best areas to stay in Sydney! Among the 6 major cities, Sydney has the highest median daily rate of A$267.

Sydney

The Emerald City is definitely included in the bucket list of must-see places for most travelers! Located on the southeastern coast of Australia, Sydney is the capital of New South Wales and is one of the largest cities in Australia. According to Sydney Tourism Statistics, the majority of travelers are for visiting for holiday wherein they spend an average of $225 per night.

Sydney is best known for iconic landmarks such as the harbourfront Sydney Opera House, Harbour Bridge, Bondi Beach & Royal Botanic Garden. Because travelers have so many fun things to do in Sydney, it is the most visited destination in the country with about 32 million visitors per year!

Melbourne

Located at the head of Port Phillip Bay, the beautiful city of Melbourne is the capital state of Victoria. Known as one of the most livable cities on earth, this city has multiple public transport options and a relatively low crime rate.

One of the fun facts about Melbourne is that it’s the first city outside of Europe & North America to host the Olympic games!

According to Victoria’s Visitor Economy, a whopping amount of A$57.8 million has been collected from Melbourne alone in 2021. It was also shown in the statistics how the visitors in Melbourne tremendously contribute to the tourism expenditure of Australia. 

Melbourne australia

Check out the best areas that you might want to invest in according to your preference:

  • For sightseeing: City Center
  • For nightlife: St Kilda
  • For families, shopping centre & beachfront areas: Docklands & St Kilda
  • For first-time visitors: City Centre
  • For food & restaurants: Southbank
  • For watching sports (tennis, golf, horse and car racing): East Melbourne

The majority of tourists in this vibrant city often stay longer than expected because of its top attractions & an unmistakably European feel. 

Brisbane australia average daily rates airbnb

Let’s discuss the compelling neighborhoods of Brisbane:

  • For sightseeing: Brisbane City Centre
  • For surfing: Burleigh Heads
  • For families: South Bank & Broadbeach
  • For outdoor activities: Kangaroo Point & Surfer’s Paradise

Finally, while it’s important to know that there are fun destinations to explore in Brisbane, another takeaway is that public transportations are accessible in this city. 

Brisbane

Along the southern slopes of the Taylor Range, Brisbane is located in the southeast corner of Queensland.

As it offers an interesting number of suburbs and Queenslander architecture, it’s also a fact that it outperformed both Sydney & Melbourne as the 39th best city in the world to raise a family. Because of Brisbane’s assurance of safety, affordability, and air quality among the others, it iconically presents that it’s definitely worth the investment!

Based on Brisbane Tourism Statistics, international visitors have contributed over $2.2 billion while domestic visitors have spent $4 billion in 2020 alone. Undoubtedly, the must-see destinations in Brisbane have attracted more tourists over the years!

Adelaide

This particular city in Australia is known for being incredibly festive – from premium wine regions to events & festivals, and various kinds of thriving food culture!

Adelaide is popular for its gorgeous heritage architecture and diverse communities. According to South Australian Tourism Commission, Adelaide has a visitor expenditure of $170 million annually and it is expected to rapidly increase over the years.

It’s also probably worth mentioning that they have low unemployment rates & a healthy economy! Since there are plenty of opportunities for internships & employment, a handful of foreign exchange students and entrepreneurs are more likely to visit and have reasons to live in Adelaide.

Darwin australia northern territory

Let’s dive into the following neighborhoods and contemplate if it’s the right match for your Airbnb business!

  • For sightseeing: Circular Quay & The Rocks
  • For nightlife: West End
  • For families: Glenelg
  • For outdoor adventure: Adelaide Hills

If you are planning to put up a business within the heart of this city, then your guests will certainly enjoy the top destinations in Adelaide!

Perth australia

Here is a list of top neighborhoods that you might consider investing into!

  • For sightseeing: City Center
  • For outdoor activities: Scarborough & East Perth
  • For food & restaurants: Fremantle
  • For families: Scarborough
  • For boat trips: Elizabeth Quay

After a thorough investigation, we also found out that Perth has the same occupancy percentage of 53% as Darwin!

Perth

A city and capital of Western Australia, Perth offers an appealing combination of old & new. In comparison to other regions in WA, Tourism Western Australia ranked Perth with the highest total number of visitors ($2.9 million) in 2021. 

The majority of tourists in this city commonly prefer to stay in the city center because of its accessibility to almost everything! Perth is proud to present its world-class wineries, botanic gardens, and wildlife sanctuaries.

In addition to this, the city has a lot to offer to tourists who are daredevils who are looking for adventurous things to do in Perth!

Darwin

If you are looking for a more isolated yet close-to-nature kind of city, Darwin is the best place to go! Located centrally on the northern coast of Australia, Darwin is the capital of the Northern Territory and is famous for humid weather.

Tourists can discover great things to do in Darwin such as waterside attractions, visit a jumping crocodile cruise, try multicultural food and so much more!

According to NT Tourism Research Australia, the room occupancy rate in Darwin is at 49% as of March 2021.

Adelaide australia

Here is a list of top neighborhoods that you might consider investing into!

  • For sightseeing: The Gardens & Mindil Beach
  • For outdoor activities: Scarborough & East Perth
  • For food & restaurants / business travelers: Central Business District
  • For families: Casuarina, Leanyer & Malak

Based on our in-depth research, this city is actually our winner when it comes to average monthly revenue. Although it has the same occupancy percentage as Perth, we also discovered that you can make up to A$57,720 annually for a 1 bed / 1 bath!

MORE AIRBNB OCCUPANCY RATES IN AUSTRALIAN CITIES?

We conducted in-depth research & utilized our Airbnb occupancy rate calculator to feature the occupancy rates of major cities! 

Australian cities with highest occupancy rates

In summary, Australia has a number of promising cities with an excellent amount of tourists visiting the country annually and this is something that an Airbnb host like you should take advantage of. While each city’s tourist spots & cultural landmarks may sound inviting in general, it’s important to have accurate data for your Airbnb business to make sure that you’ll continuously strive in the industry.

Now that you have an insight into occupancy rates in the major Australian cities, it’s certainly essential to speed up your game by having an access to a reliable data analytics tool and make sure to cover all – not just 1 bed / 1 bath for Apartment (Condo) types.

With the help of our all-in-one analytics service, you can vastly enhance your monthly revenue, create a comparison for each neighborhood, add the appropriate amenities and so many more exciting features. Try Airbtics now and stand out among your competitors!

Categories
Airbnb Occupancy All About Airbnb

Airbnb Occupancy Rates & Best Neighborhoods in Los Angeles, California

What are the best neighborhoods in Los Angeles & their Airbnb occupancy rates this 2022? Find out more accurate information in this article!

Los angeles occupancy rate california

What are the best neighborhoods in Los Angeles & their Airbnb occupancy rates this 2022? Find out more accurate information in this article!

Let’s talk about one of the most influential cities in the world — the City of Angels!

It is a fact that Los Angeles is home to countless artists, actors, athletes, entrepreneurs in various industries, and famous personalities who are vastly recognized across the globe. Located in Southern California, LA is the second-most populous city in the USA. 

According to World Atlas, LA is one of the top tourist destinations around the world which has about 4.6 million visitors annually! Undoubtedly, this city is a favorite tourist destination because it has a little bit of everything: the famous Hollywood sign, a beautiful view of the ocean, fantastic variations of gastronomy, art museums, theme parks, and so many more!

While other homeowners are considering rental arbitrage in California, knowing the occupancy rates in your preferred location is important. If you’re targeting this particular city in California to invest in an Airbnb but don’t know where to start, this article might just be the perfect guide for you.

Los Angeles City Occupancy Rates & Average Monthly Revenue

WANT TO SEE MORE?

View the free Airbnb occupancy rates data in all the cities of the world!

Los angeles california airbnb occupancy rate

Frequently Asked Questions

Yes! According to the Short-term Rental Ordinance of Los Angeles, certain conditions and requirements have to be strictly followed by STR owners.

For general questions about STR Ordinance, feel free to send a message to LA County's official email address: [email protected]

All property owners engaged in short-term rentals are required to register, collect, and remit the Transient Occupancy Tax (TOT) of 14% to the City of Los Angeles.

Bonus: There are certain exemptions - check out the qualifications for exemptions indicated in this article!

Typically, the months of August to September are the peak seasons in LA with an average of 55% occupancy rate.

As of April 2022, Santa Barbara has the highest occupancy rate of 62% with an average monthly revenue of  $7,256.

According to Airbtics' data, Airbnb hosts in Los Angeles can earn up to $41,436 per year.

Based on our thorough research using Airbtics analytics tool, it shows that Airbnb in LA is certainly profitable! As long as you can find the most ideal location for your Airbnb business and base your strategies on a reliable data analytics tool - you should be on to a good start!

According to Airbtics' data, the highest daily rate among the mentioned neighborhoods in this article is in Malibu - with a median daily rate of $720 and an average monthly revenue of $9,987!

As of April 2022, there is currently a total number of 13,553 listings in Los Angeles, California.

It's a fact that amenities are one of the winning factors for most guests, which is why we also created a separate article discussing why it's important to invest in the Top Airbnb Amenities!

According to a recent article indicating the best Airbnbs in LA, here are some of the must-have amenities that you might want to consider adding:

- Excellent & Reliable Wi-Fi

- Closet & drawer space 

- Full kitchen (+ coffee maker!)

- Bathroom with personal items & toiletries

Bonus: 24% of the overall listings in LA have a pool, too!

I'll save you some time and leave it here -- yes, it's certainly legal! Check out this article and learn more about the definition and methods of Rental Arbitrage in Los Angeles.

Based on the highest monthly revenue of $9,987, Malibu is the most recommended neighborhood in LA. 

The Rent Stabilization Ordinance in LA is a local law that took effect on April 1, 2020. This ordinance refers to limiting rent increases above the allowable limit within a 12-month period. 

For more clarifications on this ordinance, check out the official RSO released by the County of Los Angeles.

In California, a short-term rental refers to an accessory use of a residential property for the purpose of providing temporary lodging for compensation for periods of 30 consecutive days or less.

Learn more about the regulations and requirements of short-term rentals in Los Angeles, CA.

To begin with, let’s try to look at the bigger picture by targeting the Airbnb data for the entire city of Los Angeles. For every case study, we use Airbtics’ data analytics tool to come up with accurate numbers.

The data shown above is based on a 1-bedroom Apartment (Condo) in Los Angeles. It has an average occupancy rate of 46% with a median daily rate of $234 and average monthly revenue of $3,359. If this sounds promising to you, let’s check the top 10 neighborhoods in the city and their respective data!

los angeles occupancy rates

As seen on the column chart above, these are the following occupancy rates & average monthly revenue of the 10 best neighborhoods in Los Angeles. To boost the excitement, we decided to go a little more in detail and added the median daily rates for each neighborhood!

Santa Monica:

  • Occupancy Rate: 53%
  • Median Daily Rate: $218
  • Average Monthly Revenue: $4,154

Malibu:

  • Occupancy Rate: 44%
  • Median Daily Rate: $720
  • Average Monthly Revenue: $9,987

Long Beach:

  • Occupancy Rate: 58%
  • Median Daily Rate: $196
  • Average Monthly Revenue: $3,603

Irvine:

  • Occupancy Rate: 46%
  • Median Daily Rate: $197
  • Average Monthly Revenue: $3,093

Huntington Beach:

  • Occupancy Rate: 56%
  • Median Daily Rate: $207
  • Average Monthly Revenue: $4,241

Big Bear Lake:

  • Occupancy Rate: 35%
  • Median Daily Rate: $230
  • Average Monthly Revenue: $2,538

Hermosa Beach:

  • Occupancy Rate: 42%
  • Median Daily Rate: $315
  • Average Monthly Revenue: $4,439

Brentwood:

  • Occupancy Rate: 41%
  • Median Daily Rate: $191
  • Average Monthly Revenue: $3,126

Santa Barbara:

  • Occupancy Rate: 62%
  • Median Daily Rate: $326
  • Average Monthly Revenue: $7,256

Joshua Tree:

  • Occupancy Rate: 47%
  • Median Daily Rate: $95
  • Average Monthly Revenue: $1,695

Top 10 Best Neighborhoods in Los Angeles

santa monica california occupancy rates
Santa Monica

A beautiful beachfront city located in Western Los Angeles County, Santa Monica is famous for being a walkable & bike-friendly town. According to the City of Santa Monica Tourism, this particular city attracts over 8 million visitors annually!

Some of the favorite scenic spots are the Santa Monica Pier, the Museum of Flying, and the Hippodrome. There are also carnival attractions and talented street performers & tourists can enjoy a handful of exciting activities when they visit Santa Monica. Relatively, this is where business-minded people like you should pitch in strategic ideas to maximize your Airbnb’s profit.

Malibu

“Here I am, next to you, the sky is so blue – in Malibu”, yes, Miley Cyrus was accurately describing just how breathtaking this place is. Located along the Pacific Coast Highway, this city is famous for its landmarks such as Malibu Lagoon State Beach, Point Dume, Malibu Pier, & Zumba Beach.

Although this city is known as the home for Hollywood stars and top athletes, it’s not exclusive for them alone. Numerous tourists are revisiting Malibu annually to explore its wonders and dive into appealing activities such as surfing & wine tasting!

If you were able to check our FAQs section, then you’ll definitely know that this city was rated with the highest median daily rate & monthly revenue amongst all the other neighborhoods in LA. 

Malibu california occupancy rates
Joshua tree california airbnb rates
Joshua Tree

Where two deserts meet — Joshua Tree is located in Joshua Woodlands & Antelope Valley in northeastern LA County. 

Full of wildlife history, this particular neighborhood has nine developed campgrounds within the park. Because the area itself offers a unique LA experience with outdoor activities, they have a record of 2.8 million annual visitors according to National Geographic. Some of the must-see tourist attractions in this area are the Cholla Cactus Garden, Skull Rock, Hidden Valley Nature Trail & Cottonwood Spring Oasis.

During our research, we discovered that the Joshua Tree has the lowest average monthly revenue due to the specific listing that we filtered (1 bed, 1 bath) using our data analytics tool. However, its overall occupancy rate & monthly revenue was surprisingly high in studio-type rooms.

Irvine

Behold, the economic center of Southern California in Orange County — Irvine! With the overwhelming number of tourists visiting this place, the Irvine travel industry has contributed over $49 million in local and state taxes alone in 2019. 

Based on Greater Irvine Chamber, tourists spend the highest amount on accommodations in Irvine.

In this neighborhood, there are also numerous attractions including Irvine Spectrum Center, Tanaka Farms, Disneyland Resort, San Joaquin Wildlife sanctuary & other exciting places that most tourists would definitely love to see.

irvine california airbnb daily rates
brentwood california average daily rate airbnb
Brentwood

If you are particularly targeting travelers with families as your guests, Brentwood is the most recommended neighborhood to invest in. Located at the base of the Santa Monica Mountains, Brentwood has plenty of outdoor recreation opportunities with backyards that offer the best views of LA.

Some of the favorite tourist sights are Old MacDonald’s Farm, Brentwood Cathedral, The Farmers Daughter Produce & Hopefield Animal sanctuary.

In addition, this neighborhood was also marked with a lower crime rate & is safer than 94% of LA neighborhoods.

Hermosa Beach

From the Spanish word itself ‘hermosa’, this ocean frontage is truly beautiful. Located just six miles south of LA International Airport, Hermosa Beach hosts events such as volleyball tournaments and surf festivals which attract visitors annually.

Some of the famous local landmarks are the Vetter Windmill, Roundhouse Aquarium, Les Bacon Ford & Redondo Beach Pier.

According to South Bay Business, the median property value in this neighborhood is rapidly increasing annually and the households have a median annual income of $136,702.

Hermosa beach california airbnb
big bear lake occupancy rate california
Big Bear Lake

The jewel of the San Bernardino National Forest, Big Bear Lake, is located within the heart of Southern California.

Yearly, there is an average number of 3 million visitors in this neighborhood. Remarkable landmarks in this area include Big Bear Alpine Zoo, Butler Peak, Castle Rock Trail, Boulder Bay Park, and Pine Knot Village.

Summer activities such as water sports, mountain climbing, fishing, and other outdoor exercises in Big Bear Lake will make this trip worthy to travel to!

Long Beach

Considered as the 7th largest city in California, visitors of Long Beach can actually generate an estimated amount of $300 million in the overall economic benefit to the city! Tourism is a very important industry – especially in this neighborhood. 

Popular for its waterfront attractions, it is also known for hosting the Grand Prix of Long Beach (IndyCar race) and pride festival & parade. Because of numerous fun events held in this area, business travelers in various industries are also consistently traveling to Long Beach annually. 

Some of the best sights & historical landmarks in Long Beach are El Dorado Nature Center, The Pike Ferris Wheel, Belmont Shore & Downtown Long Beach.

long beach california airbnb occupancy rates
Huntington beach california average occupancy rates
Huntington Beach

Located in Southern California between LA & San Diego, Huntington Beach is also proud to present its breathtaking ocean views and is accessible to 3 airports.

Similarly, this neighborhood attracts a handful of tourists yearly because of surfing competitions, particularly the U.S. Open of Surfing. The Huntington Beach Pier, Old World Village, Hamboards, and Bolsa Chica Ecological Reserve are among the many tourist attractions in this area.

While there are great activities to do in Huntington Beach, it’s also important to take note that its average occupancy rate is at 56% in comparison to other beach areas in Los Angeles.

Santa Barbara

Last but definitely not the least – one of the most glamorous towns in California, Santa Barbara is a year-round tourist destination. While it’s important to know where to go in Santa Barbara, let’s not forget that this is our winner with the highest occupancy rate of 62%!

Surrounded by numerous fascinating landmarks such as Casa del Herrero, Old Mission Santa Barbara, The Courthouse, and Chumash Painted Cave State Historic Park – this neighborhood is definitely worth investing in.

According to Santa Barbara South Coast, this particular neighborhood has about 28,000 visitors daily as it welcomes an average of 7.2 million tourists yearly.

los angeles california best neighborhoods airbnb

Based on our in-depth research in Los Angeles, all of the top 10 neighborhoods are offering various sets of promising views & attractions to help you thrive in your Airbnb business. However, with their respective occupancy rates for 1 bed / 1 bath apartment (condo) types, it is difficult to gauge if the rates are stable according to your preferred listing. To make this less difficult for hosts like you, having an access to an excellent data analytics tool is essential to support your business.

If you will base your assumptions on articles portraying poorly estimated costs or a wild guess, then you will certainly find inaccurate results. Since you already have a broad perspective of occupancy rates for apartment types this 2022, don’t settle!

With the help of our all-in-one analytics service, you can vastly enhance your monthly revenue, create a comparison for each neighborhood, add the appropriate amenities and so many more exciting features. Try Airbtics now and stand out among your competitors!

Explore The Most Profitable Airbnb Locations Near Los Angeles

Unlock Worldwide
Short-Term Rental Data
Find unsaturated neighborhoods with the highest occupancy history.

airbnb occupancy rates in los angeles

airbnb occupancy rates in los angeles

airbnb occupancy rates in los angeles

Annual Airbnb Revenue in Campbellsville kentucky, USA

Campbellsville, Kentucky| Airbnb Market Data & Overview | USA Campbellsville, Kentucky Airbnb Market Data & Overview USA Is it profitable to do Airbnb in Campbellsville, …

Read More →
best areas in Nottingham for buy to let
Best Areas in Nottingham for Buy-to-Let Investments: Top Airbnb Markets

The best areas in Nottingham for buy to let investments can help investors to embark on a worthwhile investment journey. Find out more in this …

Read More →
vacation rental management canada
5 Best Vacation Rental Management Canada [2023]

Explore the best vacation rental management in Canada. Increase your revenue from holiday rentals by teaming up with Airbtics’ Top Picks. Home > Resources > …

Read More →
Annual Airbnb Revenue In Guanajuato City Mexico

Guanajuato City| Airbnb Market Data & Overview | Mexico Guanajuato City Airbnb Market Data & OverviewMexico Is it profitable to do Airbnb in Guanajuato City, …

Read More →
Annual Airbnb Revenue in Gulfport florida, USA

Gulfport, Florida| Airbnb Market Data & Overview | USA Gulfport, Florida Airbnb Market Data & Overview USA Is it profitable to do Airbnb in Gulfport, …

Read More →
Annual Airbnb Revenue in Walsenburg colorado, USA

Walsenburg, Colorado| Airbnb Market Data & Overview | USA Walsenburg, Colorado Airbnb Market Data & Overview USA Is it profitable to do Airbnb in Walsenburg, …

Read More →

Categories
Airbnb Occupancy All About Airbnb

Airbnb Occupancy Rates & Top-ranking Boroughs in New York City

If you have ever heard of Frank Sinatra’s song “New York, New York” or watched films that have been set in New York City, then you can definitely understand why this particular city is recognizable around the globe! 

New York City is situated in the northeastern part of the United States and is ranked as the most populous city with a winning number of 8,177,025 according to the 2022 Population Statistics. Some of the most visited tourist attractions in New York City are Times Square, The Statue of Liberty, Central Park, The Empire State Building, and the list goes on!

Undoubtedly, this city has a lot to offer to both tourists and locals who are aiming to enjoy while earning money in a city that never sleeps. According to a recently published article about NYC’s economic outlook, rents in NYC have continuously increased without interruption this 2022.

This simply means that for a variety of reasons, more and more people are looking for apartments to rent that are situated within the heart of NYC. If you are one of the numerous dedicated hosts in the Airbnb industry who would like to invest in NYC, continue reading!

new york city
New York City Occupancy Rates & Monthly Revenue

In order to accurately check the average occupancy rates and monthly revenue of the 5 Boroughs in New York City, we utilized the features of Airbtics data analytics tool.

As presented on the column chart above, the 5 Boroughs in NYC have been categorized according to their respective occupancy rates and filtered into 2 beds / 2 baths – Apartment (Condo).

Bronx:

Occupancy Rate: 50%

Median Daily Rate: $127

Average Monthly Revenue: $2,064

Brooklyn:

Occupancy Rate: 55%

Median Daily Rate: $194

Average Monthly Revenue: $3,321

Manhattan:

Occupancy Rate: 50%

Median Daily Rate: $267

Average Monthly Revenue: $4,302

Queens:

Occupancy Rate: 49%

Median Daily Rate: $159

Average Monthly Revenue: $2,375

Staten Island:

Occupancy Rate: 52%

Median Daily Rate: $120

Average Monthly Revenue: $2,227

Frequently Asked Questions

1. New York Data-Sharing
Due to a recently amended law in NYC, all Airbnb and other short-term rental platforms are required to share data on Airbnb about listings and you (as a host). You will have to agree on sharing your personal data (such as your name, physical address, profile ID number, etc.) with the city, or else you won't be allowed to host short-term stays.

2. Obtain a special license or permit to operate. For more information, you can consult the City's official portal. 

3. Pay taxes, of course. Check out the official tax bulletin from NY State for more information.

4. Abide by other rules or contracts. This includes leases, condo boards, or rules established by tenant organizations. It's important to read your lease agreement or check with your landlord about further regulations.

Learn more about New York City's Legality & Regulations.

Typically, the months of July to September are the peak seasons in New York with an average of 57% occupancy rate.

According to Airbtics' Data, the average daily rate in New York is $205 for studio-type rooms, while for an apartment (Condo) is $204.

As of April 2022, Brooklyn has the highest occupancy rate of 55% with an average monthly revenue of  $3,321.

According to Airbtics' data, Airbnb hosts in New York City can earn up to $37,896 per year.

Based on Airbtics data, it shows that Airbnb in NYC is DEFINITELY profitable!

Let us try to set aside the fact that NYC has natural powers in attracting more visitors annually and focus on this: There is an ongoing rents surge that you can take advantage of! 

Yes, advertisements for rentals in Class A dwellings are currently banned. This is in violation of the Multiple Dwelling's Law restrictions on short-term rentals.

Though taxes may vary accordingly, some examples of taxes that are applicable to your listing are state sales and use tax, city hotel room occupancy tax, and the like.

Check out the official details from NYC's Department of Finance about hotel room occupancy tax.

It's a fact that amenities are one of the winning factors for most guests, which is why we have to be guided by a list of Airbnb must-have amenities.

According to a recent survey from Streeteasy, here are a few perfect amenities for New Yorkers:

- In-Unit Laundry

- Dishwasher

- Parking

- Centralized AC

- Shared Outdoor Space

how much can you make on airbnb

5 Boroughs in New York City

Bronx occupancy rates new york

Bronx

Bronx is the only district in NYC located on the mainland and is known for its hip-hop culture. Some of its most iconic attractions are The Yankee Stadium, Urban Zoo, & NYC Botanical Garden.

According to The Bronx Tourism Council, almost a hundred of thousand visitors are traveling to Bronx annually to discover the city and its beautiful hidden treasures.


Brooklyn

Brooklyn is situated on the southwestern Long Island of NYC and is commonly known for the iconic Brooklyn bridge, museums, botanical gardens, and the like.

In comparison to other boroughs, Brooklyn’s population is diverse as it currently has 2.5 million inhabitants.

This simply explains why it has the highest occupancy percentage for apartment types in the city. 

brooklyn airbnb nyc
manhattan new york city occupancy rates

Manhattan

Manhattan is a coextensive New York County and is considered as one of the world’s foremost financial centers. If you are looking for the #1 tourist attraction in New York City — it’s definitely the Statue of Liberty, located in Manhattan!

According to the Office of NY State Comptroller, the majority of NYC’s tourism jobs (57%)  are located in Manhattan. In addition to this, the hotel industry in this city has the highest wages of any county in the nation.

Queens

Queens is the second-largest among all the five boroughs in New York City and it has a variety of higher educational institutions.

As stated by Metropolis Moving, Queens has the most affordable housing & an average apartment rental can be as low as $2,090. 

queens new york city
Staten island new york city

Staten Island

Staten Island is often referred to as the “borough of parks” in NYC because of its tremendous natural spaces. It is also known for the ferry that transports New Yorkers & tourists from Manhattan for free!

Situated in the southernmost borough in New York City, Staten Island offers top-rated tourist attractions which captivate the hearts of tourists from all over the world.

Among all the other boroughs in New York cITY, Staten Island has the highest monthly revenue.

MORE OCCUPANCY RATES IN NEW YORK CITY?

Learn more about how to find Airbnb occupancy rates in the major cities of the world!

occupancy rates new york city

As seen in the gathered information, all the boroughs in New York City have their fair share of interesting target markets to thrive in an Airbnb business. Based on their respective occupancy rates for apartment (condo) types, it is safe to say that you no longer need to conduct in-depth research from time to time if you have an access to the excellent data analytics tool to support your business.

If you will base your assumptions on articles portraying poorly estimated costs or a wild guess, then you will certainly find inaccurate results. Since you already have an idea and vision of NYC’s occupancy rates for apartment types this 2022, don’t settle!

With the help of our all-in-one analytics service, you can vastly enhance your monthly revenue, create a comparison for each borough, add the appropriate amenities and so many more exciting features. Try Airbtics now and stand out among your competitors!

Free Webinar

Learn Airbtics in 7 Minutes

Revenue and market analysis Tips and Best Practices!
Airbnb Data
Airbnb Data

ARE YOU IN?

Get Access to our weekly data-driven airbnb report!