fbpx
Categories
Guides

Discover Airbnb Occupancy Worldwide: How to Find Short-Term Rental Occupancy Rates

Last updated on September 5th, 2023

Find Airbnb Occupancy Rates

Discover Airbnb Occupancy Worldwide: How to Find Short-Term Rental Occupancy Rates

find airbnb occupancy rates

Discover Airbnb Occupancy Worldwide: How to Find Short-Term Rental Occupancy Rates

Learn how to find Airbnb occupancy rates worldwide profitable occupancy rates per continent & top short-term rental markets to invest in 2022

Are you thinking of purchasing or subleasing a property for the purpose of Airbnb & short-term rental? Then you might have heard Airbnb hosts and investors discuss certain key metrics on forums like BiggerPockets or Facebook Groups. In order for your property to succeed, it’s important to learn about Airbnb key metrics such as occupancy rates and average daily rates. And when we say succeed, we mean profitable!

These Airbnb key metrics will help define and reassure you that your hard-earned money will turn into an even greater profit for each property that you’ll invest in. Airbnb occupancy rates by city vary depending on specific neighborhoods and suburbs, which should also be considered when starting an Airbnb business.

In this article, we gathered the essentials that all property investors and Airbnb hosts should know about finding Airbnb occupancy rates, how to analyze a target property for short-term rental, along with the top 3 markets of Airbnb occupancy rates per continent – WORLDWIDE! Continue reading to learn more and be a pro in the short-term rental industry.

Defining Airbnb Occupancy Rate

Defining a particular area’s Airbnb occupancy rate is certainly an effective way to gauge whether a property investment will be profitable or not. In the first place, it’s worth knowing that pouring hard-earned money into property investment will result in profitability and success.

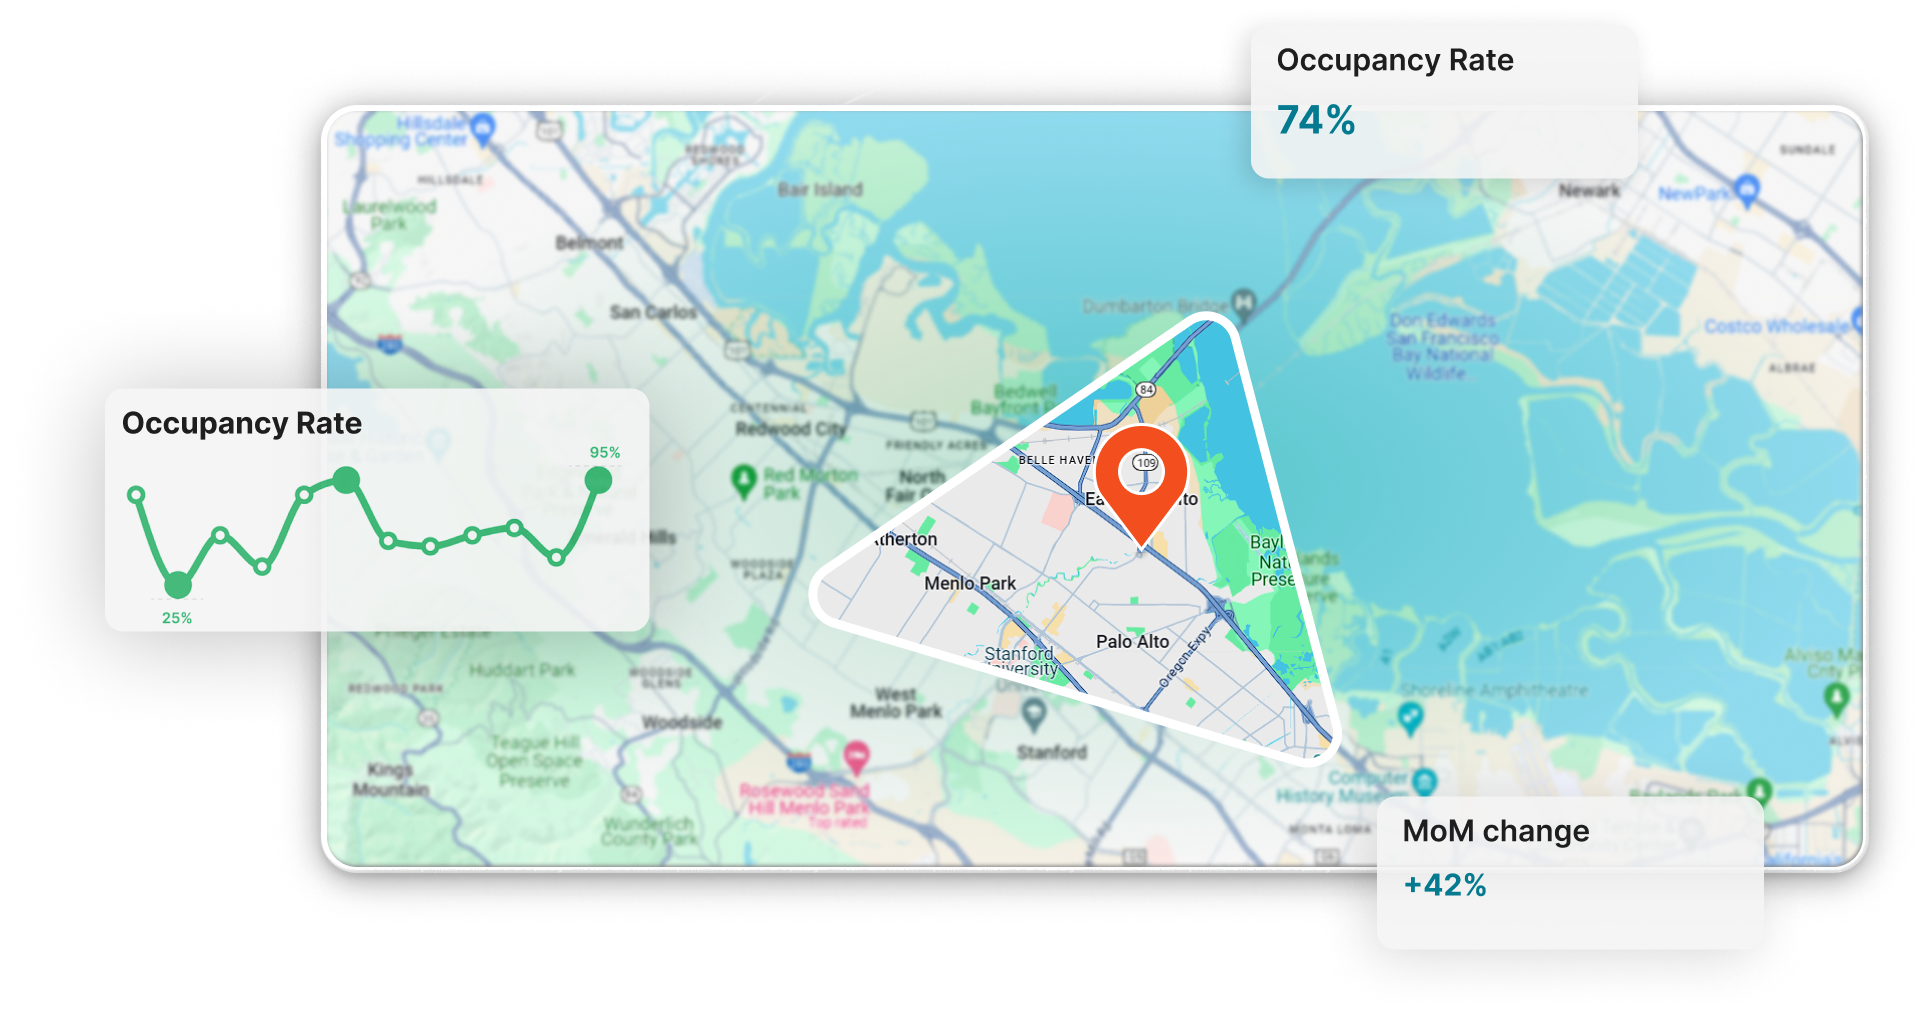
For instance, based on an accurate Airbnb calculator, property investors can easily tell that investing in an Airbnb in Brighton will exceed their expectations on occupancy rates. By looking at various competitors’ performance within your preferred area, you can have an overview of revenue potential based on certain property types & amenities.

find airbnb occupancy rates

Source: Airbtics Dashboard

Essential Airbnb Key Metrics

Aside from tracking your competitors’ performance, Airbnb key metrics or vacation rental metrics are primarily important to help hosts and investors to set expectations towards the business, overcome challenges during off-seasons, and help calculate overall finances. 

To cut the story short, Airbnb key metrics help one’s success in the business. This is why it’s important to rely on accurate data when it comes to identifying a property’s Airbnb key performance to make sure that expectations are met. Here are some of the Airbnb key metrics that one should take note of:

1. Occupancy Rate

Airbnb occupancy rates refer to the number of days that a property is booked by guests in a particular time period within a calendar year. To properly understand the market’s demand, it can be calculated by dividing the number of booked nights by the number of available nights.

2. Seasonality

The seasonality of an Airbnb property refers to a cyclical variance in the traveler’s demand throughout the year. While there are peak and off-seasons in the short-term rental business, it’s essential to be extra creative and strategize. If there is a huge gap between the high & low seasons, it can be outdone by renting out the property to digital nomads, students, and other guests during off-seasons. 

3. Average Daily Rate

The Average daily rate (ADR) represents the daily revenue that a property can make. While other hosts track their ADRs annually, you can also track them quarterly depending on your preference. 

This can be calculated by dividing the total bookings revenue by the total number of nights booked. However, the results can be more accurate by considering the expenses including taxes & cleaning fees.

In addition to this, another important Airbnb key metric to gauge your business’ performance is the RevPAR (Revenue per available room). Based on your property’s average daily rate and occupancy rate, this key metric will help you determine each unit’s revenue generated. It can be calculated by multiplying your property’s average daily rate & occupancy rate.

4. Cash-on-cash Return

Cash-on-cash return measures the annual return made by an investor on a particular property. It can be calculated by dividing the received net cash flow by the amount of money invested.

For investors who are handling more than 1 property, they can also compute and compare the most cost-effective properties through a key metric called Revenue per Property. Revenue per property can be computed by dividing the gross rental revenue by the total number of available properties in a certain period of time.

5. Net Operating Income

Setting aside a property’s operating expenses, the revenue that it generates is called a Net Operating Income (NOI). 

This will help hosts & investors determine whether it’s necessary to make improvements in terms of lowering operating costs to gain more profit. It can be calculated by deducting your gross income from the overall operating expenses. 

6. Average Length of Stay (ALOS)

This Airbnb key metric refers to the average number of days that an individual guest has booked a property. ALOS can be calculated by dividing the total number of nights booked by the total number of various guest bookings. Typically, it falls into one of the following categories: single night, short stay (2-5 nights), weekly stay (5-15 nights), and mid-term stay (30-90 nights).

How to Find Airbnb Occupancy Rates?

In order to accurately gather a property’s occupancy rate, the best technique is to use an Airbnb occupancy rate calculator. Generally, getting a particular area’s occupancy rate is never an easy task, which is why Airbtics gives hosts and investors the superpower to access accurate data from across the globe.

find airbnb occupancy rates

Source: Airbtics

By simply indicating your city on the search bar and changing the filters according to your property type & the number of bedrooms and baths, you can find occupancy rates and other very important data crucial to your property’s success. Using Airbtics’ calculator, you can discover the following comprehensive data points:

  1. Occupancy rates, average daily rates, and annual revenue
  2. Seasonality
  3. Average Length of Stay (ALOS)
  4. Top-performing listings & hosts in a preferred area
  5. Revenue heatmap

How to Analyze an STR Property?

When performing an analysis on a short-term rental property, it’s important to understand the following terms that investors use:

1. Cash-on-cash Return

How long will it take for your invested money to reciprocate? Cash-on-cash return refers to the calculation of cash income earned in an investment property. A high cash return means that in a specific amount of time, you will be able to start a second investment property.

2. Net rental yield

How much money will a property generate every month? By measuring the gap between a property’s overall costs and income, net rental yield can be calculated. A high net rental yield will represent a high volume of cash flow on a monthly basis.

There are also other factors to consider in order to properly create an analysis on a short-term rental property:

  • Location

Depending on your preferred location to start a short-term rental business, looking closely at a specific area is essential to identify your target market. For instance, if you’d like to invest in a small city or destination location near coastal areas, you are more likely to attract tourists or digital nomads.

Pro tip: Targeting the market in your area with the highest occupancy rate = more profit!

find airbnb occupancy rates
  • Demand & Supply

Short-term rental demand usually differs according to tourist attractions, festivals, year-round popularity, business centers, shopping districts, and the like. 

Taking a close look at an area’s demand and supply can instantly give you an idea if there are sufficient rentals to start a business in your preferred area.

find airbnb occupancy rates
  • Seasonality

There are short-term rental properties that are situated in high & low seasons – which should be considered when performing an analysis on short-term rentals. For instance, one of the most popular beach areas in the UK is Brighton, which has shown an impressive occupancy rate of 84% in June and 100% in July. Because it is the summertime season, more tourists are expected to book.

Having low seasonality means that you will get bookings consistently year-round.

In certain places, this is more desirable than high seasonality. One of the best examples of a high seasonal market is ski resort towns. Properties in ski resort towns often get good bookings only during the winter, so hosts and investors are likely to have low cash flow in non-season. Some people prefer it, but when it comes to the attractiveness of investment, the low-seasonal market is considered better.

find airbnb occupancy rates
  • Revenue

The revenue performance of an STR property can be measured using the mentioned Airbnb key metrics such as average daily rates, RevPAR, and gross annual revenue. Some of the factors that affect revenue are:

1. Promoting Airbnb listings & maintaining consistent positive reviews.
2. Offering the best amenities for Airbnb & vacation home rentals.
3. Airbnb pricing strategies and discounts offered during off-seasons.

Airbnb Occupancy Rates Worldwide 2022

Since the importance of Airbnb occupancy rates has been well-defined in this article, let’s continue to highlight and discuss the Airbnb data per continent. In order to figure out the best places to do short-term rental investments, we used Airbtics’ calculator to filter the top 3 markets to invest in for each continent!

find airbnb occupancy rates
AFRICA

According to Quartz Africa, Airbnb’s growth in the African continent has been one of the eight fastest-growing markets globally. Particularly in Nigeria, Ghana, and Mozambique, Airbnb has been considered one of the most affordable lodgings available for travelers in Africa.

  • Average Occupancy Rate in Africa: 3%
  • The highest occupancy rate in comparison to West Africa
TOP 3 SHORT-TERM RENTAL MARKETS IN AFRICA:
Seychelles
find airbnb occupancy rates

Seychelles is known for its white-sand beaches, lofty granite boulders, palm-fringed forests, and azure waters are the ethos of Seychelles tourism. With over 500,000 tourists visiting Seychelles yearly, this 115-island archipelago offers Asian and African cultures.

  • Median Daily Rate: $151
  • Occupancy Rate: 50%
South Africa
find airbnb occupancy rates

South Africa is notably remarkable for having 10 of UNESCO’s world heritage sites because of its exquisite landscapes and wildlife. Relatively, there have been over 14 million tourists visiting South Africa annually.

  • Median Daily Rate: $67
  • Occupancy Rate: 23%
Cape Verde
find airbnb occupancy rates

Known for most Europeans’ winter escape, Cape Verde offers a tropical paradise with tasty gastronomy. Cape Verde is one of the domestic travel destinations in South Africa with over 3 million visitors every year.

  • Median Daily Rate: $67
  • Occupancy Rate: 23%
EUROPE

Europe is the second smallest continent in the world, but it offers so many extraordinary sceneries at minimal distances for travelers. Airbnb in Europe declares that there are over 345,000 jobs which generate a whopping amount of €19 billion because of tourist spending.

  • Average Occupancy Rate in Europe: 37%
  • The highest occupancy rate in comparison to all continents worldwide
TOP 3 SHORT-TERM RENTAL MARKETS IN EUROPE:
Luxembourg
find airbnb occupancy rates

Known as the second richest country worldwide, Luxembourg offers fantastic wages to the majority of employees. Its combination of French & German cuisine attracts both local & international tourists from across the globe. 

  • Median Daily Rate: $93
  • Occupancy Rate: 71%
The Netherlands
find airbnb occupancy rates

The Netherlands is one of the most visited countries in Europe because of its labyrinth of romantic canals, windmills, cheese markets, and so much more. Over the last year, there have been 6.3 million foreign tourists that stayed in Dutch tourist accommodations.

  • Median Daily Rate: $112
  • Occupancy Rate: 68%
Iceland
find airbnb occupancy rates

Iceland is recognized for its rich cultural history and folklore, along with its wondrous volcanoes and glaciers. Its foreign overnight visitors have increased by 44% with a total number of 700,000 visitors annually.

  • Median Daily Rate: $164
  • Occupancy Rate: 64%

Bonus: Discover the most profitable areas for Airbnb in major cities of the UK. 

LATIN AMERICA

Known as the most urbanized continent in the world, Latin America is now Airbnb’s fastest-growing market, according to recent news. Currently, people speak more than 370 languages in Latin America. This continent also has a wide variety of natural resources and a very interesting history of art and literature.

  • Average Occupancy Rate in Latin America: 22%
  • The highest occupancy rate in comparison to Oceania
TOP 3 SHORT-TERM RENTAL MARKETS IN LATIN AMERICA: