The beautiful capital city of England & United Kingdom – London, is one of the most visited cities in the world. Despite the restrictions implemented amidst the pandemic, this city remains to be one of the most popular destinations visited by numerous travelers across the globe.
Relatively, as travelers look for their ideal place to stay in London, the demand for Airbnb is expected to rapidly increase. According to iProperty management, over 50% of guests prefer to stay at an Airbnb than a traditional hotel for various reasons and an experienced host can earn an average of $10,000 annually.
While this may sound enticing to Airbnb hosts who would like to invest their time and money, you have to keep in mind that some neighborhoods may not offer an equal amount of return on investment.
The good news is that we’ve created this article to guide you through!
Frequently Asked Questions
airbnb occupancy rates London
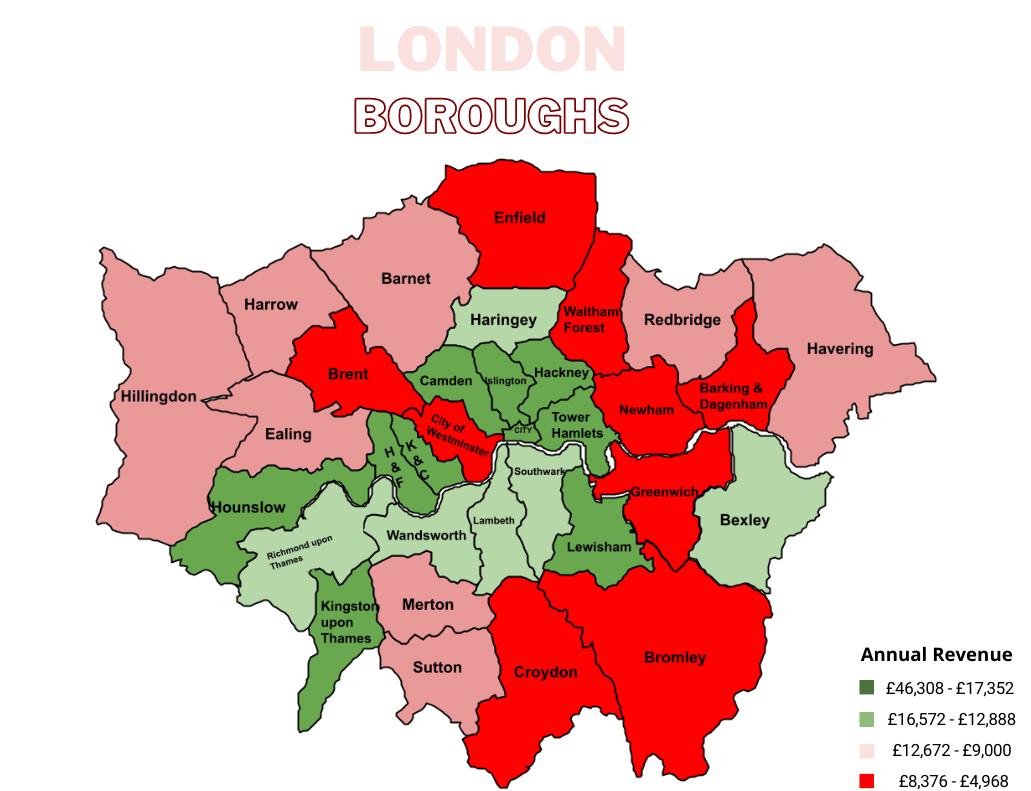
A heatmap is a data visualization technique that helps users to comprehend and analyze the data presented in various colors.
For instance, this map of London above represents the boroughs with the highest & lowest annual revenues.
Primarily, Airbnb hosts like you will benefit from using the heatmap by identifying which are the highly profitable neighborhoods in your area.
Through this accurate & reliable information, you can compare each listing in order to strategize properly and answer the most important question: is it going to maximize your revenue in the long run, or not?
If you are looking forward to running your Airbnb business in the long term, strategizing your occupancy & daily rates as well as learning where to invest in property in London are just as important as maximizing your revenue.
Thanks to technology, you can analyze all that using an accurate data tool that can help you estimate your earnings!
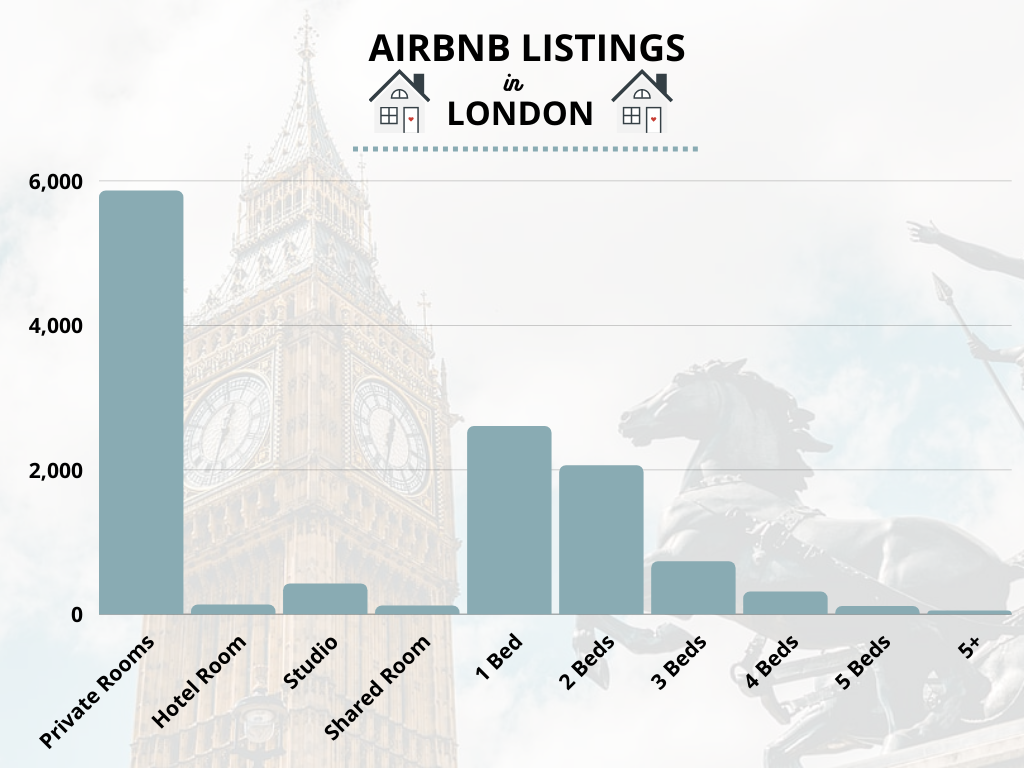
As of April 2022, here is the statistics for Airbnb listings in London!
This kind of market-specific information is important especially for hosts like you – whether you have an entire property available, or just wish to rent out private or shared rooms.
Through this, you can easily strategize & tap into the huge Airbnb market!
Based on our research, the most preferred listing in London is private rooms with a total number of 5,862.
Total number of listings: 18,398
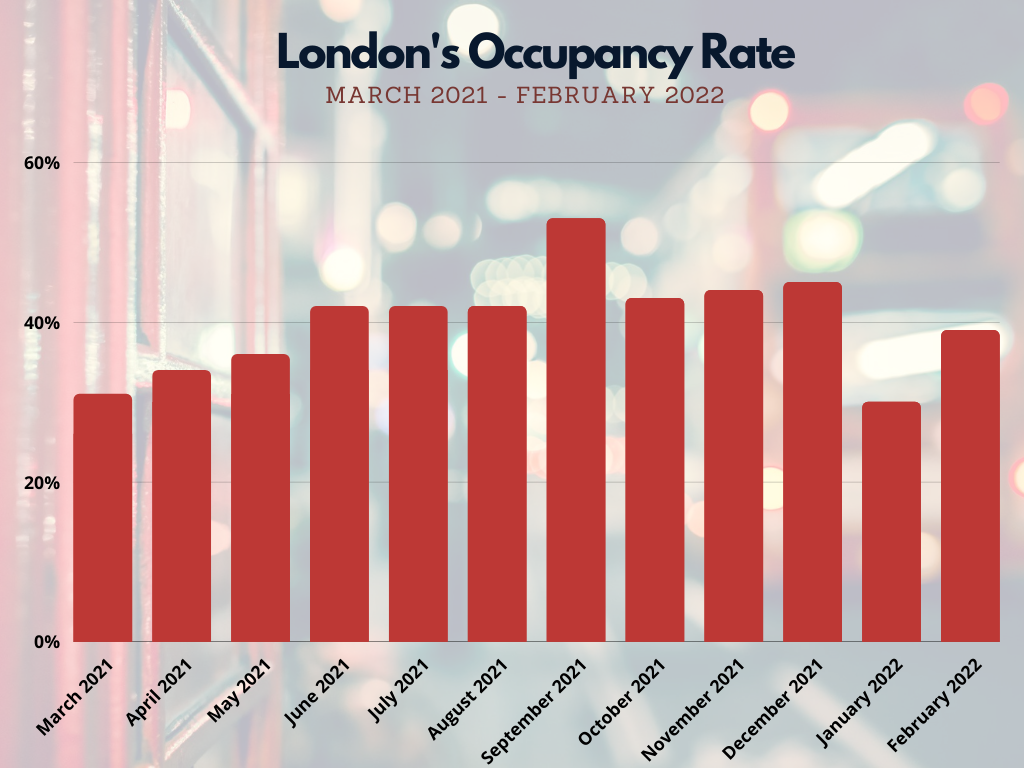
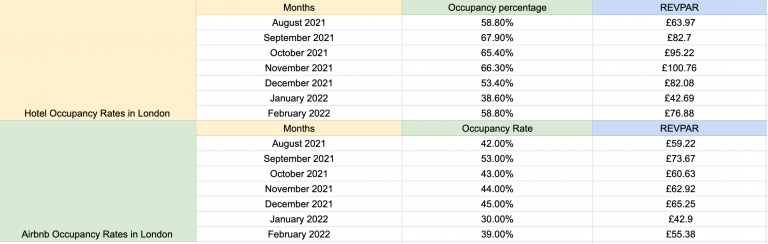
Having an estimated percentage of your occupancy rate is one of the most essential key performance indicators for hosts in the Airbnb business.
This refers to the proportion of days in a month for which your property has bookings.
Primarily, as seen on the stacked bar chart, London’s highest occupancy rate in 2021 is during the month of September with a percentage of 53%.
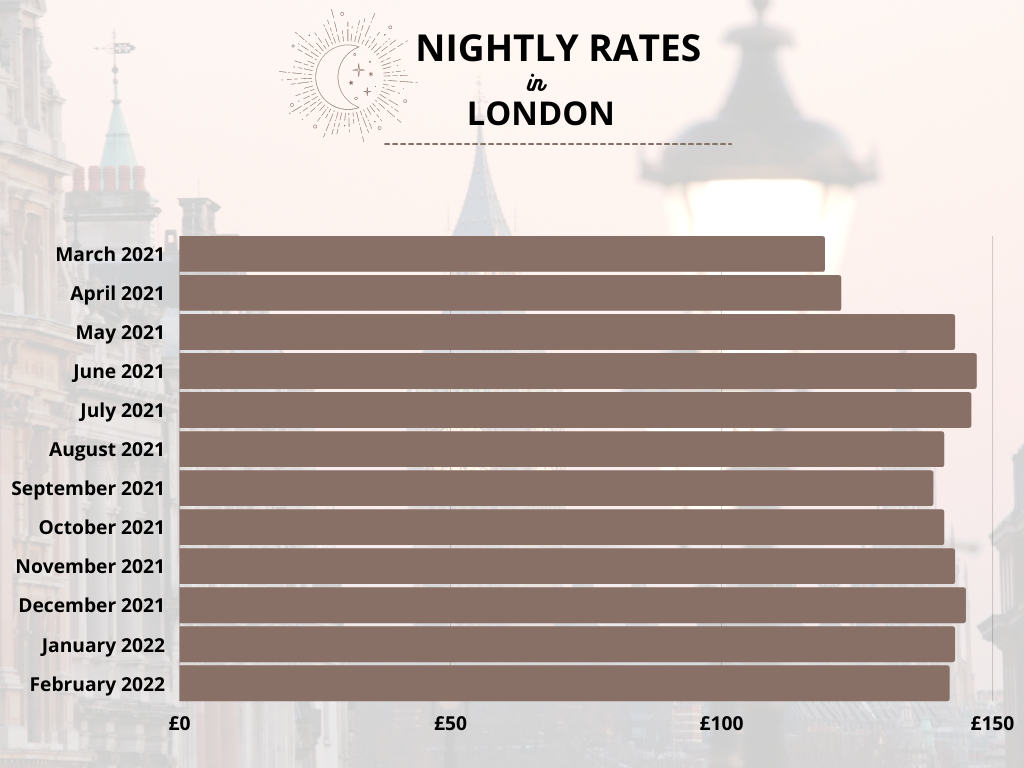
Here is a stacked row chart that contains the nightly rates in London. It’s noticeable that since March 2021, there has been a great increase!
Relatively, the month of June ranks first with the total amount of £147, while the month of March is ranked least with the total amount of £119.
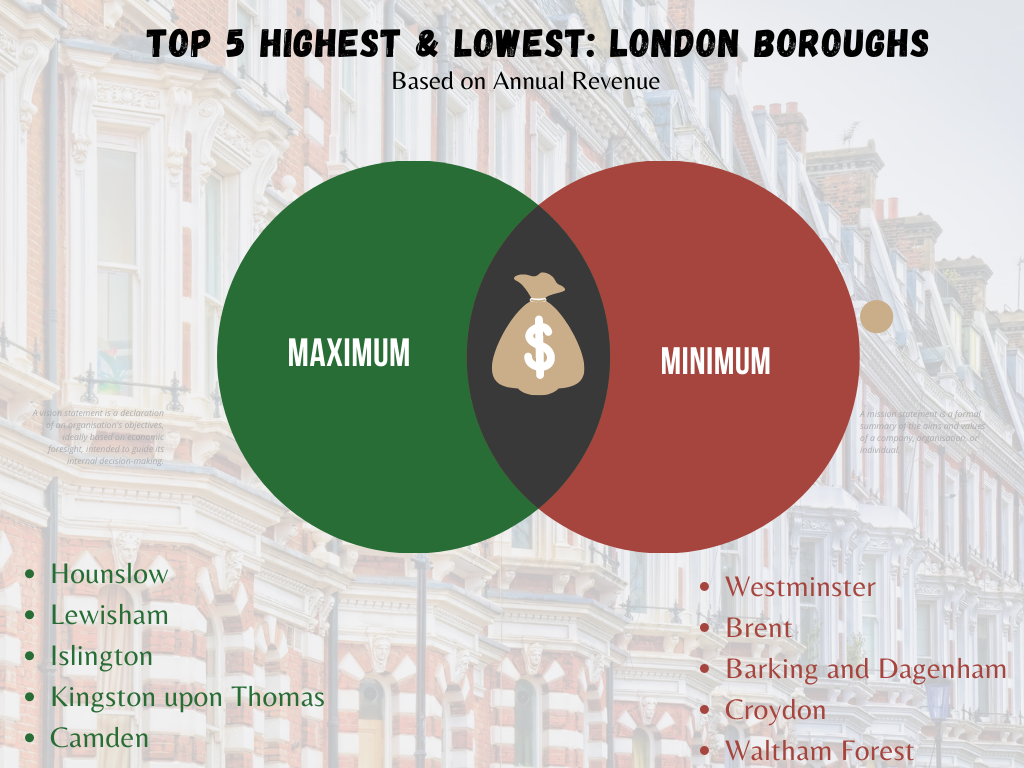
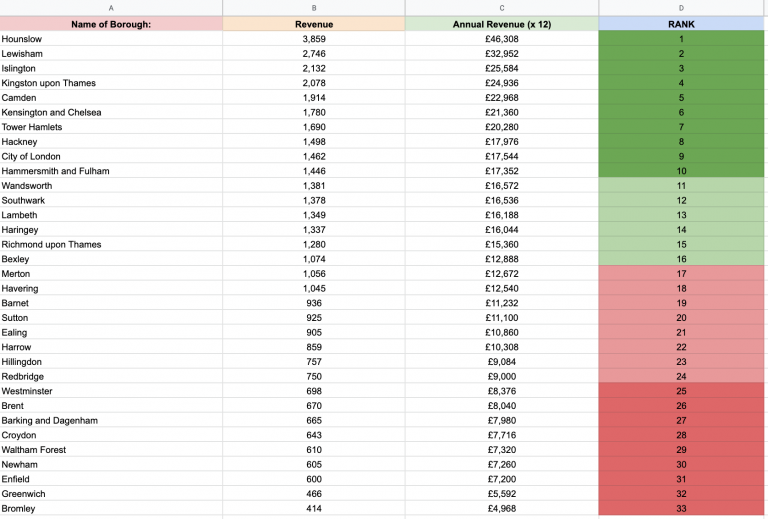
Finally, here are the top 5 highest & lowest boroughs in London based on their respective annual revenues.
Based on in-depth research, this document contains accurate data on London boroughs for studio-type rooms including the annual revenue & occupancy rate using Airbtics tool.
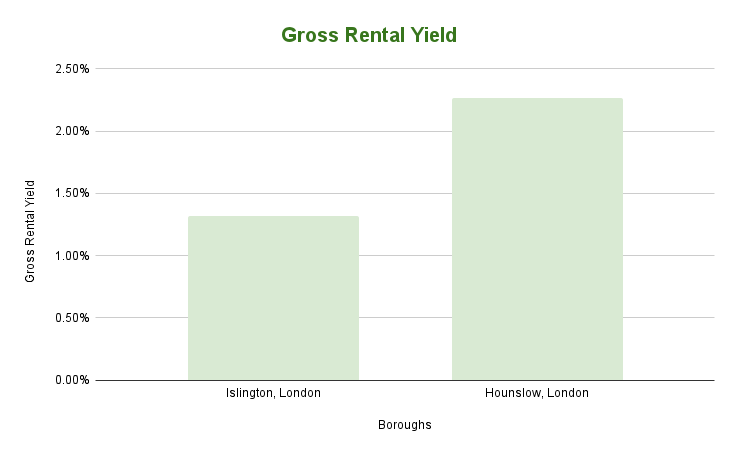
Here is a comparison chart between Islington and Hounslow. Based on our spreadsheet about London Boroughs, you would know that these two are ranking first on both occupancy rates & annual revenue among all the boroughs in London.
As presented on this chart above, Hounslow has a higher gross yield of 2.27% which means that it is the best borough to invest in London! Please take note that during this research, we have filtered the properties in studio-type rooms.
Boroughs
Studio Price
Annual Revenue
Islington, London
£138,000
£1,824
Hounslow, London
£170,000
£3,859
After a thorough investigation, we have come to the conclusion that as long as you have chosen the right location to invest in, it is definitely recommended to try investing in London! Aside from the fact that it is one of the most popular destinations in the world, the opportunity to maximize your revenue is limitless. In addition to this, Airbnb hosts like you should consider using a data analytics tool in order to get along with the fast-shifting industry. This will not only help you strategize in London but anywhere in the world, such as in other best buy to let locations in the UK!
 Airbtics | Airbnb Analytics