fbpx
Categories
Case Studies

The rise of Domestic Tourism in 2020 and How to leverage data to increase tourism in your city

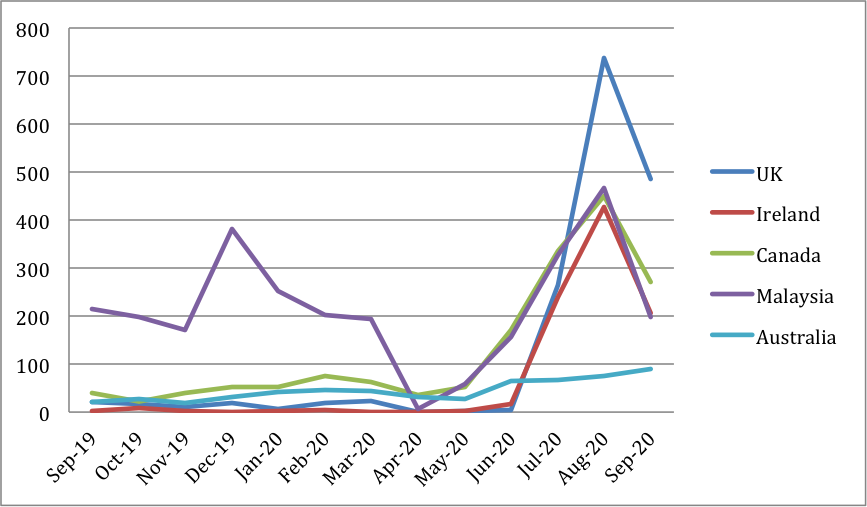
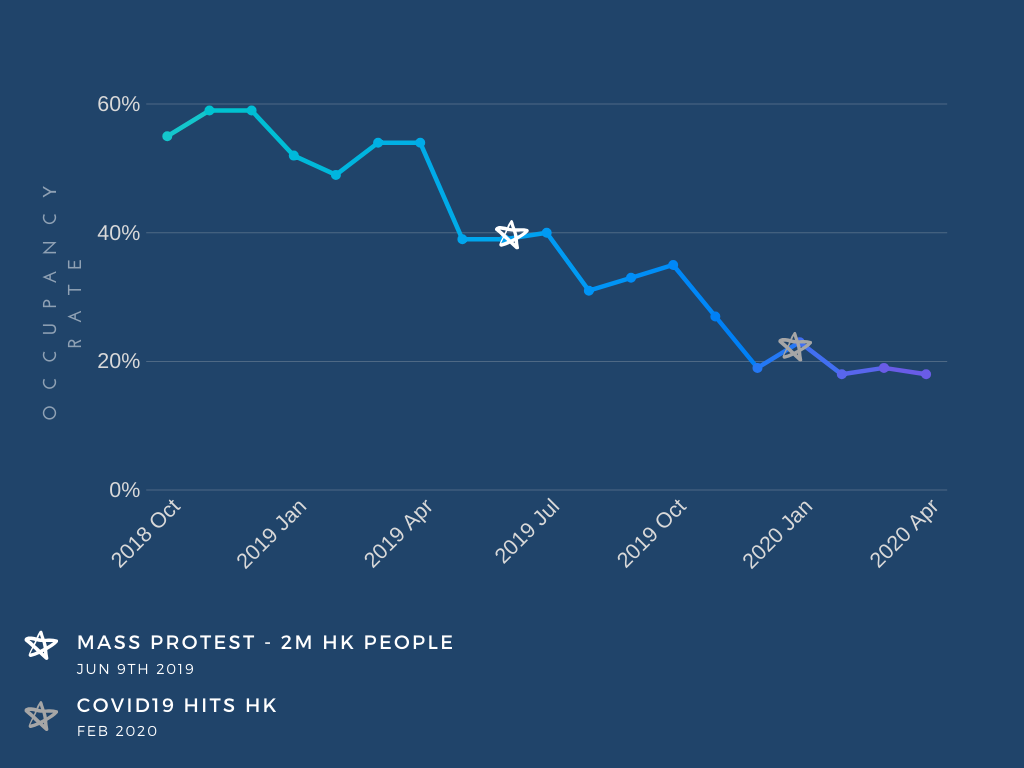
Table of Contents

How has Covid-19 affected international tourism?

There is an estimated decline of 58% to 78% on international tourist arrival this year due to the Covid-19 pandemic, as stated by UNWTO. With planes forced to stop flying and borders closed between countries, people have no choice but to stay put. Looking at the current situation, international travel does not seem to be going back to normal any time soon and people have gradually turned to domestic travel. There are several cities that managed to recover economically from the pandemic through domestic tourism.

Increase in domestic tourism

Although international tourism may be essential for a greater growth in future, domestic travel will help to achieve more sustainable tourism revenue all year round, especially when faced with potential seasonal and regional restrictions.

Domestic vs. International Tourists in Ireland

Based on our data from Airbtics, Ireland, for example, has been facing a constant drop on the number of international tourists from September 2019 onwards. On the other hand, the graph shows an upward trend on the number of domestic tourists, and it surpasses the number of international tourists in April 2020. Tourism Northern Ireland highlighted the importance of their marketing efforts targeting the domestic market as domestic tourism has contributed to 31% of the country’s tourism revenue in 2018 and there is a further increase in domestic travel by 7% from 2018 to 2019, based on the Northern Ireland Statistics and Research Agency (NISRA).

In Australia, our research data have shown that Covid-19 did have a massive impact on the ratio of domestic and international tourists, beginning from April 2020. However, it also shows the percentage of domestic travel in the country has constantly been higher, even before the pandemic. Hence, by designing good marketing campaigns to tap on the domestic trend may help to boost the tourism revenue.

Surge in staycations

There has been a growing interest in staycation, where locals choose to stay in other accommodations in their country. This is apparent from June 2020, after the lockdown period in most countries. According to our data on Airbnb bookings, the countries that show the greatest surges in staycation are the United Kingdom, Ireland, Canada, Malaysia and Australia.


Number of people on staycation

The above graph shows the number of times the word ‘staycation’ was mentioned, pulled from every 1,000,000 Airbnb guest reviews in the UK, Ireland, Canada, Malaysia and Australia. From the risen trend of mentions from June across all five countries, it is likely that many of these Airbnb guests have turned to domestic travel for their summer vacations. 

Gain Exclusive Insight

Take a look at how DMOs and Travel Boards are utilising data to adapt to the change and increasing visitors to their destinations

How do some DMOs adapt to the change?

We have seen many DMOs that initiated marketing campaigns by introducing their digitalized platforms to stay connected with their fellow consumers. An example of this is the Singapore Tourism Board (STB), who aims to promote domestic tourism by introducing digitalized experiences and partnering with various organizations that share similar target audiences. One of the partners includes Airbnb Experience, where they worked together to introduce virtual tourism experiences on the attractions in Singapore. STB also has a seven months long collaboration with Klook this September, where they encourage locals to take on adventures and explore a different side of Singapore


A similar campaign was also carried out in the United Kingdom. Visit England partnered up with DMOs across the country, where they started the “Escape the everyday” campaign in September. On their platforms, they share different types of things to do across regions, with the hope to boost domestic travel through this autumn and winter. Moreover, social media influencers are engaged in their promotions, which may appeal to the younger crowd and motivate them to join in the domestic tourism trend.


It is important for DMOs to be aware of the changes before they can adapt to them. So first, identify the trends and target markets frequently. From there, anticipate their needs and wants, which would then help in curating effective marketing strategies. Airbtics possesses a huge amount of data related to short-term rentals around the world. We provide our clients with up-to-date information based on their needs, such as the most popular regions amongst visitors, top few origins of visitors that are visiting the city, the amount they spend on accommodations, their travel expectations and much more. 

What should DMOs do to boost tourism?

DMOs act as a platform between suppliers and consumers on what their city has to offer. In brief, there are five key points for DMOs to effectively increase the number of visitors.

  1. Identify the majority profiles of people visiting at different time points

This is the most basic yet crucial step. Knowing your market, it is like fishing where the fish are. Our team has spoken with multiple DMOs over the past few months who shared insights on the difficulties in getting specific data such as the top three guests’ origins who are visiting their cities. Hence, many resorted to getting the rough gauge of their visitors’ profiles by means of guessing. Airbtics uses Artificial Intelligence (AI) technology in getting data of visitors through Airbnb reviews. We are able to get the data for any regions specified by our clients for as low as $65 per month. Feel free to have a read on our free case study to help you get a better understanding on how we can help tourism boards attract visitors through a cost-effective and smart way.     

  1. Understand and anticipate the needs and wants of your target market

By keeping your organisation updated with the latest travel and market trends, you can better understand what people are looking for and how you can market your products as best befits the needs of your consumers. Numbers speak louder than words, with access to real time data from Airbtics such as the increase in usage of “staycation” amongst guests helps in the realisation of trends. Domestic tourism has great potential and is proven to be a viable market, hence DMOs should consider looking at it as more than a short-term plan.

  1. Ensure your website is up to date with credible and relevant information

In this digital age where people look for most information online, it is essential to have a one-stop website with an abundance of credible and relevant content as well as direct links to local businesses that is neatly categorised, easy to navigate and highly accessible via online search engines.

  1. Take advantage of the social media tools

With the growing number of people on social networking these days, being active and responsive on social media platforms help to drive traffic and build rapport with consumers, thereby, gaining their trust. The great thing is the possibility to reach out to the market and gain awareness through organic marketing strategies. That is the beauty of technology!

  1. Collaborate with other organisations to reach out to bigger audiences

Through partnerships with other organisations, it would benefit both parties that are working towards a common goal in bringing out more innovative ideas, reaching out to more people and gaining access to larger amounts of databases, which would be helpful for future marketing.

Gain Insider Access

Take a look at how DMOs and Travel Boards are utilising data to adapt to the change and increasing visitors to their destinations
Categories
Case Studies

Did Covid just destroy the short-term rental market?

What do the . say about their rentals?

We have interviewed above 30 Airbnb hosts during the pandemic (Between mid-March – July), and 4 out of 5 Airbnb hosts have broken even.


Some of them had to receive mid-term or long-term bookings, which they wouldn’t have done last year. Those bookings were from various people including 1) people who rented a place to work as a personal office while working remotely 2) people who go to secluded private rental for a getaway 3) a couple who don’t have to work in NY so just decided to stay in their rental in Florida. 

You can hear their individual stories from our podcast blog. Here are 3 featured interviews.

Insights from the Airbnb booking data

  • On average, the US market is doing better than Europe and Asia Airbnb markets. 
  • In the US, many vacation destinations have fully recovered or even doing better than last year’s same period in July. 
  • In Asia, the China market is rebounding. 
  • In Europe, vacation destinations like Cornwall in the UK and Nice in Southern France have been recovering fast. 
  • Places with low population density are less affected by the pandemic.

China YoY Airbnb booking

Airbnb occupancy rate YoY growth in china

Europe YoY Airbnb booking

Airbnb occupancy rate YoY growth in Nice, Cornwall

US YoY Airbnb booking

Airbnb occupancy rate YoY growth in Big Bear Lake, Jacksonville, NYC

Conclusion

Although the total amount of travel activities were significantly reduced, people are still using Airbnb. It’s worth noting that some regions have recovered fully or even doing better than last year.

Categories
Case Studies

Which cities in the world are most profitable to do Airbnb?

Just over a year ago, me and my colleague were talking about what would be the highest rental yield one can make whilst working in London. 

Out of many ideas, one thing that caught my ears was a story from this woman who is doing Airbnb rental arbitrage in Canary Wharf with twenty 2-bedroom units. 

She would rent a 2 bedroom apartment at £1,800/month and she’d put that house on Airbnb at £180 per night. 

I did a quick search on Airbnb and Zoopla to confirm those numbers, and yeah, those numbers made sense. 

That meant if the house is 70% booked, it will make 3,600/month and after paying rent and other expenses, the profit could be easily above 1,000/month per unit. Seems doable. 

The competition in Canary Wharf seems to be getting intense and I wanted to leave London and live somewhere else in the near future. There must be more better opportunities in other cities.

If I can continuously identify such opportunities, worldwide, I can be rich. 

It’s easy to find out long term rental prices. But, how can I find out how much I can make on Airbnb? I can check out nightly rates from Airbnb website, but how do I know occupancy rates? 

So I started searching for occupancy rates of Airbnb in different locations. The data doesn’t exist. Yes, maybe there is some data online saying “Airbnb occupancy rates in London is 45%” but it is too ambiguous. I needed more detailed information. 

I’ve found one service offering Airbnb data outside of the US, but it was too expensive ($400+ to see data for 10 cities), and many reviews said data can be inaccurate. 

That’s when I decided to work on building an affordable and accurate analytics platform. 

I’ve started scraping data from Airbnb. Millions of listings. I’ve started interviewing Airbnb hosts asking them about their occupancy rates and ROI. 

After a few months, I’ve started to see the patterns. I’ve built regression models on top of it. Then, scrape data, readjust the models, interview Airbnb hosts and repeat the whole process again and again. 

The happiest moment is when Airbnb hosts tell me that my number is pretty close to theirs. 

Feel free to take a look on my app, you can click below. 

Categories
Case Studies

Airbnb booking data from Europe shows sign of a recovery

Vacation rentals in Europe have just begun to recover. We have analyzed over 300,000 Airbnb listings across various cities in Europe and the UK this week.

One major pattern that is observed in the past month is that the vacation destinations in countries with high domestic Airbnb guests have started getting more bookings in June 2020.

For example, the UK has been having high domestic Airbnb guest ratio with above 50% of guests are travelling from the UK. The major coastline destinations in the UK, such as Brighton and Cornwall have experienced a surge in Airbnb bookings as soon as the UK has relaxed the lockdown in 2nd July. 

Countries like Spain and Italy have been relying highly on international travellers and their bookings aren’t so good yet. 

Please note that many other cities are not in the below charts but are receiving a healthy amount of bookings. If you’d like to know the number of Airbnb reservations made in June in your area, please use our market research app! (Also, make sure to add your city if it’s not available in the platform)

Please read this post to understand how we have gathered these data. The charts show the YoY growths in a number of nights booked – from January to beginning of July 2020. 

4 European Vacation Destinations show a sign of a recovery

More domestic travellers, less international travellers

Stay Insightful

Airbtics is the short-term and vacation rental market research platform. We help rental hosts, property investors, realtors to understand the rapidly changing rental market by providing insights via our web service.

If you have any further questions about the case study, please contact us at [email protected].

All the data here without explicit references are sourced and processed by our technologies.

Categories
Case Studies

US Airbnb market snapshot (2020 June) during the pandemic

Vacation rentals in the US have been rapidly recovering since June. We have analyzed over 200,000 Airbnb listings this week. Our research showed that the Southern States, like Texas, South Carolina and Florida, have successfully made a comeback, yet New York and California states are still struggling. 

Please note that many other cities are not in the below charts but are receiving a healthy amount of bookings. If you’d like to know the number of Airbnb reservations made in June in your area, please use our market research app! (Also, make sure to add your city if it’s not available in the platform)


Please read this post to understand how we have gathered these data. The charts show the YoY growths in a number of nights booked – from January to June 2020. 

Airbnb listings in these cities are doing well!

Airbnb listings in these cities aren't..

More domestic travellers, less international travellers

Stay Insightful

Airbtics is the short-term and vacation rental market research platform. We help rental hosts, property investors, realtors to understand the rapidly changing rental market by providing insights via our web service.

If you have any further questions about the case study, please contact us at [email protected].

All the data here without explicit references are sourced and processed by our technologies.

Categories
Case Studies

Is data backing up on what Airbnb CEO stated about Post-Covid travel?

Recently, Airbnb CEO says post-COVID travel will never be the same again and added that people are more likely to travel domestically. 

Our analysis also confirmed with this trend by analyzing 5 million short-term rental booking data from 2019 December to 2020 May. 

In order to write this blog post, we have chosen 4 states from the US – California, New York, Florida, and Texas. And, we have selected Australia, Germany, Singapore, Portugal, Brazil, Canada, Mexico, Spain, France, Italy, Greece, Netherlands, Ireland, Japan, China and the United Kingdom. 

For each booking, we have classified them into two categories, domestic and international. Then, grouped those booking data by each month and country to observe how the ratio has changed since 2019 December.


Please read this post to understand how we have gathered these data. 

Airbnb booking trend in Europe

Airbnb booking trends in Asia and Australia

Airbnb booking trend in America

Conclusion

As you can see in the above charts, the percentage of domestic travellers has been increasing. However, I don’t see any further evidence that this isn’t a temporary increase. If you look at China, their international traveller ratio has been bounced back to the pre-Covid19 level. 

Categories
Case Studies

How do we get vacation rental data?

Airbtics gathers and updates its data with this five-step process.

1. Source the data

Airbtics collects short-term and vacation rental data from dozens of sources, including Airbnb, independent property managers, and rental software providers.

2. Monitor the data on a regular basis 

Acquiring rental data is just the beginning. This data is continually tracked, with various information collected and updated at different time points. This allows us to understand specific occupancy rates, pricing strategies, revenue, booking lead time, and guest demographics. 

3. Use cutting edge technology to understand the profitability of rentals 

We also use machine learning and statistical techniques, such as, binary classifications, natural language processing, time-series analysis, to understand seasonality and revenue. Binary classifications is the practice of classifying elements of a set into two separate groups based on a classification rule. At Airbtics, we use binary classification to find and recognize certain patterns in data, such as how the head to ratio or certain amenities can increase or decrease revenue in specific areas. 

Natural language processing (NLP) is the process of using software to automatically manipulate natural language, the way we communicate with each other (speech and text). NLP allows us to take mass amounts of unstructured speech and text data generated every day and efficiently automate the analytics process. We extensively use NLP to analyze listings’ titles, summary and reviews to help identify insights that can make your short-term rental business unique.

The third statistical technique we use at Airbtics to understand the profitability of rentals is time-series analysis, which is a method of “analyzing time series data in order to extract meaningful statistics and other characteristics of the data”. This technique is significant because we use time series analysis to understand historical data and forecast future trends in a way that is helpful for STR investors.

Using the mentioned techniques, we are able to achieve our end goal, which is to understand the underlying factors that make vacation and short-term rentals profitable and bring substantial ROI.

4. Process calendar data

One of the most popular questions we get is: How do we know if the Airbnb calendar is booked vs. blocked by themselves?

Thanks to intensive qualitative research on dozens of Airbnb hosts to understand their common behaviors and patterns, we are able to create precise estimations of calendar availability. And by analyzing calendar data of listings at different periods, we are able to develop a model that can predict the availability of listings. 

5. Analyze each market before showing them on our platform

For every region imported into the Airbtics platform, our team validates and ensures the accuracy of the gathered data through thorough research of that region. This is to clean up any data anomalies that come up. If you do not see your region on our dashboard, don’t hesitate to contact us.

The Airbtics data team is always reviewing their data processing models to give you the most accurate portrayal of the STR market.

Categories
Case Studies

A snapshot of the Indonesia Airbnb market in 2020 (VS Hotel)

Indonesia may have been late to start in the Airbnb market but it’s one of the fastest-growing countries in Southeast Asia in terms of inbound travel. Indonesia ranked 20th in the world tourist industry in 2017. [1] Now, because of the worldwide lockdowns due to coronavirus pandemic, there is a significant threat in the whole Airbnb industry. 

What will happen to the short-term rental market? Can the industry’s leading home-sharing industry survive? What is the current state of Indonesia’s Airbnb market? Let’s find out. 

How Many Total Airbnb Listings are there in Indonesia?

Indonesia currently has over 61,000 listings as of May 2020. The top location is the Bali province which has around 34,000 listings. Next in rank is Jakarta with 6,000 listings. 

Surabaya and Medan are the second and the third largest cities by population, they only have 870 and 250 Airbnb listings. For example, Paris has a similar size of the population as Surabaya, and it has 30,00 Airbnb listings. 


Bali province shows the highest number of listings in all the Indonesian AirBnB market. It surpassed Jakarta which is Indonesia’s capital city and home to over 10 million people in terms of the average daily rate.

What is the average daily rate of Airbnb in Indonesia?

This chart shows the average daily rate of Airbnb 2 bedroom apartments and hotels [2] in Indonesia. Based on the statistics, the ADR of a 2 bedroom apartment in Indonesia is $100. The rest of the locations including Jakarta, Yogyakarta, and Surabaya are in the $30 – $40 range. 


Bali has a lot more international travellers than Jakarta. We can observe here that there is a positive correlation between the high ratio of international travellers and high Airbnb ADR.

Indonesia Airbnb average daily rate
Source: STR (Hotel ADR 2016), Airbtics (Airbnb ADR 2020)

What is the occupancy rate of AirBnB in Indonesia?

Indonesia Seasonal Airbnb Occupancy Rate
Source: Airbtics

The chart shows the yearly occupancy rate in Jakarta, Bali, Yogyakarta, and Surabaya (Data Captured in May 2020). The occupancy rates are calculated with the past three years of historical occupancy rate but weighing more to more recent occupancy rate. 

The hotel occupancy rate is for 2016, and the Airbnb occupancy rate is calculated from the data between 2017 – 2020. Still, it is clear that the occupancy rate of hotels is higher than the occupancy rate of Airbnb. 

Indonesia Airbnb Occupancy Rate
Source: Hotel (STR, 2016), Airbnb (Airbtics 2020)

What is the average revenue of the top 10% and 25% performing 2bedroom houses?

Indonesia Airbnb yearly revenue
Source: Airbtics

Here’s a graph showing the most profitable or the top-performing 10% 2-bedroom houses in Indonesia. Based on their yearly revenue, top10% 2-bedroom properties in Bali have estimated annual revenue of $28,000. This is followed by Surabaya at around $11,000

The chart shows the yearly revenue of the top 10% and 25% 2BR houses in Jakarta. South Jakarta’s top 10% leads with $9,000 yearly revenue followed by the top 10% of Central Jakarta which is at $8,000.

Jakarta Airbnb yearly revenue
Source: Airbtics

Amenities

Based on our data, 85% of 2BR houses in Bali and Jakarta have pools and only around 17% of the 2BR houses have hot tubs. Amenities are important factors that impact travel experience, especially for foreign travellers. When it comes to Airbnb vacation rentals, many people are looking for functionality first then comfort, and lastly perks such as pools, hot tubs, and free parking. 

Conclusion

Jakarta, Surabaya, and Yogyakarta are large cities with a high ratio of domestic tourist, and their home-sharing markets are still at an early stage. Their ADR and the occupancy rate are low in comparison to the hotel industry. So, now is a good time to travel to these cities in Indonesia. Also, if you are thinking about starting an Airbnb in Indonesia, there are good opportunities, because there isn’t much competition due to the small amount of Airbnb supply. 

Stay Insightful

Airbtics is the short-term and vacation rental market research platform. We help rental hosts, property investors, realtors to understand the rapidly changing rental market by providing insights via our web service.

If you have any further questions about the case study, please contact us at [email protected].

All the data here without explicit references are sourced and processed by our technologies.

Categories
Case Studies

Impact of COVID-19 on Airbnb bookings in Seoul, Taiwan, Berlin, Milan

The impact of COVID-19 has been quite severe in the last few months on the vacation rental industry. There was a significant number of cases reported in some cities that reversed the predicted drop of Airbnb bookings there. It has been observed that there is a reduction in the short term stays compared to the long term stays.

If you have been wondering how COVID-19 has impacted the bookings in major cities, and what can be expected in the upcoming months, then this will be a great article for you. Here, we will be particularly comparing the impact of the pandemic on Berlin with respect to Seoul, Milan, and Taipei.

Germany missed the chance they had, in February 2020

The number of Airbnb bookings was measured in the month of Oct, Nov, and Dec of 2018 as well as 2019. This percentage difference of 2018-19 was used to predict the number of bookings if there was no impact of the COVID pandemic in the cities.

It was observed that Seoul, as well as Milan, experienced a fall of about 25% bookings in 2020 Feb, and Taipei suffered from a 42% drop. On the other hand, Berlin had a normal Airbnb booking rate because people still traveled, and this was a good indicator of the surge of covid19 confirmed cases in March. 

airbnb-reservation-decrease-in-feb
covid-19-increase-march-bar-graph

But the scenario has completely changed owing to the COVID -19 pandemic. There were 300 multiplied confirmed cases in Berlin between 5th March and 30th March.  

Germany and Italy are worst hit by the pandemic and so is their Airbnb bookings:

In Seoul and Taipei, there were almost negligible new confirmed COVID cases in April. At the same time, Germany and Italy are the countries which are worst hit by the pandemic. This is the reason why we do not find any significant Airbnb activity in Berlin and Milan when Taipei is seen to perform the best among these four in the month of April.


After the year to year growth adjustment, Seoul is seen to have the maximum number of bookings. The decreasing order of bookings for the other cities includes Taipei, Berlin, and finally Milan.

Airbnb demand in April - Seoul, Taipei, Berlin, Milan

The comparative analysis of predicted occupancy rate versus the actual rate in February, March, and April:

covid 19 impact on short term rental industry
Number of entire place listings per district

The global pandemic Covid-19 has affected the Airbnb bookings significantly as discussed below:

  • Seoul was expected to have a 25% fall in the bookings in February which rose to 61% in March and 73% in the month of April. 
  • Taipei, as discussed earlier, was predicted to see a drop in Airbnb bookings by 42% in February but in March, there was a 68% drop and 84% drop in April.
  • For the month of February, Milan was thought to witness a 26% drop in the bookings but it was 95% in March and rose to 98% in April. 
  • Compared to all the above cities, Berlin which had no drop in bookings in February witnessed a 70%  drop in March and 95% in April. 

Booking rates have fallen, still, the scenario is not that depressing:

Despite the above falling rates for booking, the future doesn’t seem to be depressing. This is because the number of future nights booked in Berlin for May is highest among the other cities, i.e Seoul, Taipei, and Milan. This portrays a good occupancy rate for the month of May which is expected to rise higher compared to the typical listings even though there is a good portion of mid-terms stays on Airbnb.

If we consider the case of Milan, this city and Northern Italy were the COVID-19 entry points for the European continent. Even though this has resulted in a  major setback, short term rental markets will rebound quickly in case of successful containment.

airbnb next 90 days number of bookings in Milan, Berlin, Seoul, and Taipei after covid-19

Conclusion

The current impact of the COVID-19 demands changing the strategies for thriving in the short term rental industry. This necessitates analyzing the current data thoroughly as it will help in better planning for the business once the crisis gets contained. The demand has not completely stopped, it is just that its form has changed, i.e Airbnb is becoming a good option for travelers to seek medium as well as long term stays. Despite the low expectations of such vacation rental hosts, they open for business for all intents and purposes. 

Stay Insightful

Airbtics is the short-term and vacation rental market research platform. We help rental hosts, property investors, realtors to understand the rapidly changing rental market by providing insights via our web service.

If you have any further questions about the case study, please contact us at [email protected].

All the data here without explicit references are sourced and processed by our technologies.

References

All the above Airbnb related data are retrieved from Airbnb Research Tool.

Covid related data are retrieved from CoronaVirusApp.

Categories
Case Studies

A snapshot of the Hong Kong Airbnb market amidst the pandemic

Hong Kong attracts the largest number of visitors per year [ref], yet it does not have as much Airbnb listings as other popular tourist destinations like London (70,000+) or Paris (50,000+). Hong Kong was showing a rapid growth in both Airbnb supply and demand until the 2019 Hong Kong protests. Despite the current climate, we believe that it is an exciting market to keep an eye on.

How many total Airbnb listings are there in Hong Kong?

 Hong Kong has 6,760 unique active listings on AirBnB [2020 April], over half (52.4%) of which are private rooms. 

  • Entire place: 2383
  • Private room: 3541
  • Hotel room: 356
  • Shared room: 480

Other popular short-term rental channels are..

  1. Tuijia.com is the AirBnb’s major China rival, which offers around 2,000 listings. 
  2. VRBO offers similar types of properties but has less than 500 unique active listings. 
  3. Around 100 serviced apartments are listed on Booking.com. However, Booking.com does not allow above 30days’ booking. 
 
pie chart - airbnb room types in hk

Where are the Airbnb properties located in Hong Kong?

a map of number of entire places in Hong Kong
Number of entire place listings per district

Hong Kong has 18 districts, with six districts supplying 85% of the entire house listings. They are located in:

  • Tsim Sha Tsui region:
    • Sham Shui Po
    • Yau Tsim Mong
    • Kowloon City
  • Hong Kong Island region:
    • Central & Western
    • Wan Chai
    • Eastern 

Tsim Sha Tsui is a major tourist hub where Victoria Harbour and many museums are located. 

The Hong Kong Island also has some significant tourist attractions, such as the Peak and large shopping malls. It’s also the hub of numerous global financial institutions’ offices.

What is the Average Daily Rate of AirBnB in Hong Kong?

This chart shows the median of the Average Daily Rate of 2 bedroom apartments in Hong Kong by district and Superhost status, excluding anomaly prices. 

Extremely high nightly rates is one of the common anomaly patterns.

The median is the better representation (than the mean) the typical Airbnb listing price in individual districts.

heatmap adr of 2bedroom apartment by district

The ADR of 3 districts in Hong Kong Island (In the south) is around 15% higher than the ADR of 3 districts in Kowloon (In the north).  

This difference is similar to the difference in the housing prices between Hong Kong Island and Kowloon, which are also 15%.

HK Island House Price / Sq. Ft  – $13,686 

Kowloon House Price / Sq. Ft  – $11,895 [Ref]

What is the occupancy rate of AirBnb in Hong Kong?

In the time of writing [April 2020], the occupancy rate has been below 20% on average since the COVID-19 outbreak in HK.  We expect this to get back to above the 50% region when the global travel activities resume after the pandemic. 

Hong Kong’s AirBnB occupancy rate peaked in 2018, and it started declining after the Hong Kong mass protests which started in June 2019. Within a quarter, the occupancy rate went down to almost half. Unfortunately, before the market was able to fully recover, COVID-19 struck HK, causing the market to drop further.

hong kong airbnb occupancy rate historical data
Occupancy Rate of entire place listings in Airbnb Hong Kong
hong kong airbnb demand historical graph
Demand of Airbnb in Hong Kong - All types of properties


The occupancy rate aligned with the demand – This is the demand of all types of accommodations on Airbnb.

The superhost status positively affected the occupancy rate. An average two-bedroom property running by a superhost in Yau Tsim Mong and Wan Chai is 34% and 50%, respectively. [2020 April], and it is 27% and 27% if it is running by an average host.

How much can a two-bedroom apartment make in Airbnb Hong Kong?


During the pandemic, RevPAR of an average two-bedroom apartment in Wan Chai is around HK$360 ($46), with 30% occupancy rate and HK$1,200 for three guests.

The RevPAR does not look good considering a two-bedroom long-term rental can easily achieve above HK$20,000/month. (~ RevPAR HK$655)

But the top 10% Airbnb properties in HK are still doing better than long-term rentals even during the pandemic period. It is not the case for an average property. If you want to find out what are the top 10% properties are like, use Airbtics to explore. 

What is the most commonly spoken language by Airbnb hosts in Hong Kong?

English is most commonly spoken, but majority of hosts also speaks Simplified Chinese. 

pie chart of languages spoken by host
*If 1 host can speak both English and Chinese, they are counted in both statistics.

Is Airbnb legal in Hong Kong?

If you are letting out a house for less than 28 days at a time, you need to have a license provided by Home Affairs Department

Conculsion

hong kong airbnb demand historical graph
Demand of Airbnb in Hong Kong - All types of properties

The market doesn’t seem pretty, but why did I mention that I’m “excited”about the HK market?

I mentioned earlier that the Airbnb’s share in the HK market is relatively low in comparison to London or Paris. I think the HK Airbnb scene (in 2019) before the mass protest looked very similar to the London Airbnb market in 2015.

For instance, London market has experienced quick growth in both supply and demand. It showed 4 times of increase[ref] in supply within 3.5 years while maintaining above 50% occupancy rate [ref].

Consequently, it brought lots of opportunities to the professional Airbnb property managers and companies in London.

Therefore, I believe that there is a chance that the HK will resume that rapid growth it showed between 2015 and 2019. 

Stay Insightful

Airbtics is the short-term and vacation rental market research platform. We help rental hosts, property investors, realtors to understand the rapidly changing rental market by providing insights via our web service.

If you have any further questions about the case study, please contact us at [email protected].

All the data here without explicit references are sourced and processed by our technologies.

Airbnb Data
Airbnb Data

Join The Club!

Get a free weekly
Data-DRIVEN REPORT

will only send you value bombs

ARE YOU IN?

Get Access to our weekly data-driven airbnb report!