Best Airbnb Markets in World (2026)

Based on Airbtics data from September 2025 to August 2026, this page ranks the best Airbnb markets in World by Market Grade. The grade compares short-term rental yield, year-over-year revenue growth, and occupancy (demand), then adjusts for local regulation. The table also shows listing count, average daily rate, and annual revenue for every market.

Markets on this page are ranked by the Airbtics Market Grade, not by the number of listings. The grade compares each market with the other markets in this ranking on three measures, then adjusts for local short-term rental regulation.

  1. Yield: Annual short-term rental revenue divided by property price. A higher yield ranks higher.
  2. Growth: Year-over-year change in revenue. Faster revenue growth ranks higher.
  3. Demand: Average occupancy rate over the last 12 months. Higher occupancy ranks higher.

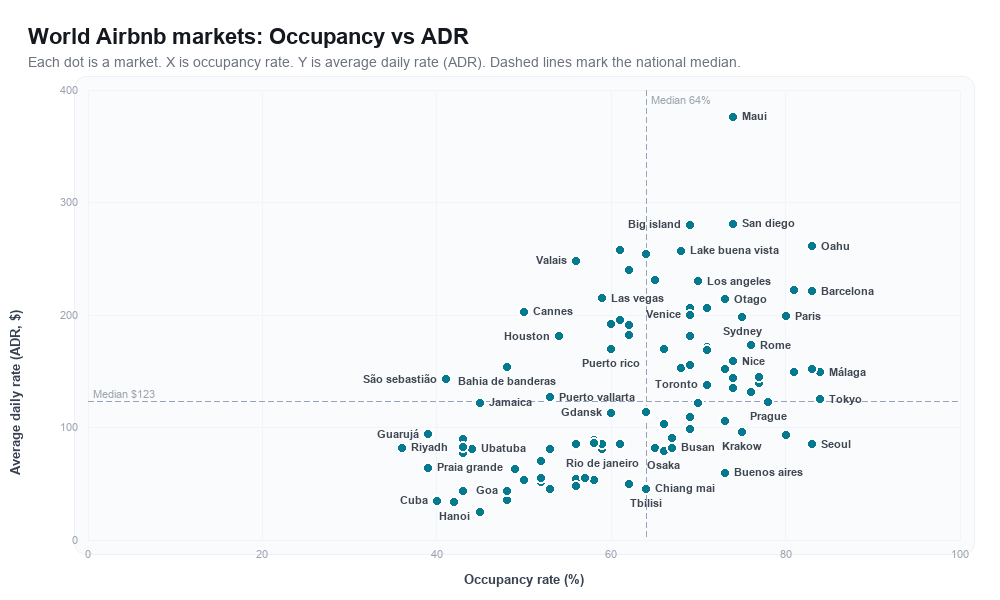
Stricter short-term rental regulation lowers the letter grade. Occupancy, average daily rate, and annual revenue are shown for every market. Exact yield and revenue growth are published for the three highest-graded markets. For every other market those two figures are in Market Explorer. The rankboard plots the same markets by occupancy and average daily rate, and the table under the chart lists those values in text.

Learn more about how we collect the data and accuracy

Last updated: 16th October, 2026

World Short-Term Rental Market Overview (September 2025 to August 2026)

National averages across all World markets
Average Occupancy Rate i
62.91%
Average Annual Revenue i
$33,026
Average Daily Rate (ADR) i
$132
YoY Supply Growth i
45.91%
YoY Revenue Change i
9.03%

Top 100 World Cities for Airbnb in 2026

Tick the markets you like to track their revenue, occupancy, and ADR in your Airbtics watchlist. Free to start, up to 10 markets.

Position Market Grade Market Name Regulation No of Listings Avg. Occupancy Rate Avg. Daily Rate Revenue Short-term Rental Yield Revenue Growth
1AMexico City
Lenient
22,36865%$82$19,95814.6%+25.8%
2APuerto Rico
Unknown
21,88460%$170$38,95515.9%+4.7%
3ABuenos Aires
Lenient
21,82773%$60$16,34720.6%+34.4%
4AOtago
Lenient
6,48273%$214$58,472Unlock in Market ExplorerUnlock in Market Explorer
5BParis
Strict
39,25780%$199$58,993Unlock in Market ExplorerUnlock in Market Explorer
6BRio De Janeiro
Lenient
32,10459%$81$17,983Unlock in Market ExplorerUnlock in Market Explorer
7BRome
Strict
28,02576%$173$49,394Unlock in Market ExplorerUnlock in Market Explorer
8BMelbourne
Lenient
19,18366%$170$42,483Unlock in Market ExplorerUnlock in Market Explorer
9BLake Buena Vista
Lenient
14,73168%$257$67,397Unlock in Market ExplorerUnlock in Market Explorer
10BPhuket
Lenient
14,43061%$85$19,195Unlock in Market ExplorerUnlock in Market Explorer
11BAthens
Strict
12,13969%$99$25,797Unlock in Market ExplorerUnlock in Market Explorer
12BJeju Island
Strict
11,73859%$85$18,800Unlock in Market ExplorerUnlock in Market Explorer
13BBudapest
Strict
10,36580%$93$28,200Unlock in Market ExplorerUnlock in Market Explorer
14BJamaica
Lenient
9,54045%$122$20,636Unlock in Market ExplorerUnlock in Market Explorer
15BValais
Lenient
9,26956%$248$52,926Unlock in Market ExplorerUnlock in Market Explorer
16BJacksonville
Lenient
8,95262%$240$57,162Unlock in Market ExplorerUnlock in Market Explorer
17BWarsaw
Lenient
8,67767%$91$23,339Unlock in Market ExplorerUnlock in Market Explorer
18BNashville
Lenient
8,15161%$258$61,644Unlock in Market ExplorerUnlock in Market Explorer
19BMarseille
Strict
8,09070%$122$31,945Unlock in Market ExplorerUnlock in Market Explorer
20BMálaga
Strict
7,66984% 🚀$149$46,715Unlock in Market ExplorerUnlock in Market Explorer
21BChiang Mai
Lenient
7,35264%$46$10,956Unlock in Market ExplorerUnlock in Market Explorer
22BKrakow
Lenient
7,27475%$96$27,240Unlock in Market ExplorerUnlock in Market Explorer
23BSevilla
Strict
7,23277%$145$41,912Unlock in Market ExplorerUnlock in Market Explorer
24BOahu
Strict
6,79883%$261$82,430Unlock in Market ExplorerUnlock in Market Explorer
25BGdansk
Lenient
6,77460%$113$26,097Unlock in Market ExplorerUnlock in Market Explorer
26BBerlin
Strict
6,52274%$144$40,028Unlock in Market ExplorerUnlock in Market Explorer
27B+Dubai
Strict
21,70369%$181$46,355Unlock in Market ExplorerUnlock in Market Explorer
28B+Cape Town
Lenient
18,88466%$103$25,177Unlock in Market ExplorerUnlock in Market Explorer
29B+Goa
Lenient
11,25948%$44$7,829Unlock in Market ExplorerUnlock in Market Explorer
30B+Malta
Lenient
9,00677%$140$40,319Unlock in Market ExplorerUnlock in Market Explorer
31B+Madeira
Strict
6,92783%$152$47,110Unlock in Market ExplorerUnlock in Market Explorer
32B+Busan
Strict
6,32667%$82$20,548Unlock in Market ExplorerUnlock in Market Explorer
33CExtended Grand Paris
Unknown
68,32873%$152$41,418Unlock in Market ExplorerUnlock in Market Explorer
34CLondon
Lenient
46,56871%$206$54,330Unlock in Market ExplorerUnlock in Market Explorer
35CBali
Lenient
40,29058%$89$19,183Unlock in Market ExplorerUnlock in Market Explorer
36CBig Los Angeles
Unknown
39,69964%$254$61,969Unlock in Market ExplorerUnlock in Market Explorer
37CQueensLand And Northern NSW
Unknown
36,24469%$206$53,501Unlock in Market ExplorerUnlock in Market Explorer
38CDominican Republic
Unknown
34,24343%$90$14,581Unlock in Market ExplorerUnlock in Market Explorer
39CMetro Manila
Lenient
28,67348%$36$6,527Unlock in Market ExplorerUnlock in Market Explorer
40CSeoul
Lenient
17,74983%$85$26,213Unlock in Market ExplorerUnlock in Market Explorer
41CLima
Lenient
16,41952%$52$10,200Unlock in Market ExplorerUnlock in Market Explorer
42CLisbon
Strict
12,98476%$132$37,769Unlock in Market ExplorerUnlock in Market Explorer
43CCornwall
Lenient
12,66260%$192$42,993Unlock in Market ExplorerUnlock in Market Explorer
44CUbatuba
Lenient
12,13644%$81$13,429Unlock in Market ExplorerUnlock in Market Explorer
45CLas Vegas
Lenient
10,91059%$215$49,000Unlock in Market ExplorerUnlock in Market Explorer
46CFlorence
Strict
10,83271%$172$45,908Unlock in Market ExplorerUnlock in Market Explorer
47CLos Angeles
Strict
10,34370%$230$61,015Unlock in Market ExplorerUnlock in Market Explorer
48CHanoi
Lenient
9,60242%$34$5,324Unlock in Market ExplorerUnlock in Market Explorer
49CSan Diego
Strict
9,34374%$281$79,348Unlock in Market ExplorerUnlock in Market Explorer
50CAustin
Lenient
8,69861%$196$45,799Unlock in Market ExplorerUnlock in Market Explorer
51CVienna
Lenient
8,21974%$135$37,652Unlock in Market ExplorerUnlock in Market Explorer
52CNaples
Strict
8,16464%$112$27,027Unlock in Market ExplorerUnlock in Market Explorer
53CGuarujá
Lenient
8,13439%$94$13,857Unlock in Market ExplorerUnlock in Market Explorer
54CMiami
Lenient
8,00165%$231$57,325Unlock in Market ExplorerUnlock in Market Explorer
55CSalvador de Bahia
Lenient
7,65352%$55$10,789Unlock in Market ExplorerUnlock in Market Explorer
56CVenice
Strict
7,45869%$200$51,995Unlock in Market ExplorerUnlock in Market Explorer
57CReunion island
Lenient
7,19169%$109$28,154Unlock in Market ExplorerUnlock in Market Explorer
58CBahia De Banderas
Lenient
7,13248%$154$27,449Unlock in Market ExplorerUnlock in Market Explorer
59CTbilisi
Lenient
6,89264%$45$10,812Unlock in Market ExplorerUnlock in Market Explorer
60CBengaluru
Lenient
6,80445%$25$4,214Unlock in Market ExplorerUnlock in Market Explorer
61COslo
Lenient
6,31669%$156$39,887Unlock in Market ExplorerUnlock in Market Explorer
62C+Florianpolis
Lenient
19,43356%$85$17,764Unlock in Market ExplorerUnlock in Market Explorer
63C+Bangkok
Lenient
16,30062%$50$11,619Unlock in Market ExplorerUnlock in Market Explorer
64C+Madrid
Lenient
15,02481%$149$45,352Unlock in Market ExplorerUnlock in Market Explorer
65C+Ho Chi Minh City
Lenient
14,30753%$45$8,865Unlock in Market ExplorerUnlock in Market Explorer
66C+Sydney
Strict
13,17475%$198$55,770Unlock in Market ExplorerUnlock in Market Explorer
67C+Santiago de Chille
Lenient
13,01457%$55$11,885Unlock in Market ExplorerUnlock in Market Explorer
68C+Riyadh
Strict
10,81836%$82$10,931Unlock in Market ExplorerUnlock in Market Explorer
69C+Guanajuato City
Lenient
9,87649%$63$11,625Unlock in Market ExplorerUnlock in Market Explorer
70C+Barcelona
Strict
9,56583%$221$68,815Unlock in Market ExplorerUnlock in Market Explorer
71C+Toronto
Strict
9,55171%$138$36,743Unlock in Market ExplorerUnlock in Market Explorer
72C+Copenhagen
Lenient
9,27981%$222$66,214Unlock in Market ExplorerUnlock in Market Explorer
73C+Houston
Lenient
9,02054%$181$37,175Unlock in Market ExplorerUnlock in Market Explorer
74C+Porto
Strict
8,96373%$106$29,232Unlock in Market ExplorerUnlock in Market Explorer
75C+Lake Garda
Strict
8,94962%$182$42,162Unlock in Market ExplorerUnlock in Market Explorer
76C+Prague
Lenient
8,90878%$123$35,946Unlock in Market ExplorerUnlock in Market Explorer
77C+Cairo
Lenient
7,64550%$53$9,952Unlock in Market ExplorerUnlock in Market Explorer
78C+Istanbul
Strict
7,09752%$70$13,718Unlock in Market ExplorerUnlock in Market Explorer
79C+Cabo Frio
Lenient
6,65143%$77$12,493Unlock in Market ExplorerUnlock in Market Explorer
80C+São Sebastião
Lenient
6,62341%$143$21,946Unlock in Market ExplorerUnlock in Market Explorer
81DSao Paulo
Lenient
35,98658%$53$11,820Unlock in Market ExplorerUnlock in Market Explorer
82DNew York
Strict
10,52071%$169$45,096Unlock in Market ExplorerUnlock in Market Explorer
83DLake Como
Strict
9,17962%$191$44,483Unlock in Market ExplorerUnlock in Market Explorer
84DCannes
Strict
8,91850%$203$38,080Unlock in Market ExplorerUnlock in Market Explorer
85DNairobi
Lenient
6,53543%$44$7,006Unlock in Market ExplorerUnlock in Market Explorer
86D+Tokyo
Strict
25,21784% 🚀$125$39,429Unlock in Market ExplorerUnlock in Market Explorer
87D+Kuala Lumpur
Lenient
20,25356%$54$11,374Unlock in Market ExplorerUnlock in Market Explorer
88D+Milano
Strict
18,39068%$153$39,275Unlock in Market ExplorerUnlock in Market Explorer
89D+Marrakech
Lenient
11,69258%$86$18,586Unlock in Market ExplorerUnlock in Market Explorer
90D+Pattaya
Lenient
9,68056%$48$10,009Unlock in Market ExplorerUnlock in Market Explorer
91D+Nice
Strict
9,14274%$159$43,891Unlock in Market ExplorerUnlock in Market Explorer
92D+Playa del Carmen
Lenient
8,91753%$81$16,065Unlock in Market ExplorerUnlock in Market Explorer
93D+Praia Grande
Lenient
8,03339%$64$9,500Unlock in Market ExplorerUnlock in Market Explorer
94D+Puerto Vallarta
Lenient
7,15053%$127$24,988Unlock in Market ExplorerUnlock in Market Explorer
95D+Maui
Strict
6,93174%$376$105,398Unlock in Market ExplorerUnlock in Market Explorer
96D+Martinique
Lenient
6,89664%$114$27,278Unlock in Market ExplorerUnlock in Market Explorer
97D+Big Island
Strict
6,58269%$280$73,493Unlock in Market ExplorerUnlock in Market Explorer
98EOsaka
Strict
13,55266%$79$20,015Unlock in Market ExplorerUnlock in Market Explorer
99ECuba
Unknown
7,03140%$35$5,231Unlock in Market ExplorerUnlock in Market Explorer
100E+Tulum
Lenient
6,54343%$83$13,437Unlock in Market ExplorerUnlock in Market Explorer

Data Seen By

Market Explorer

Filter markets by occupancy, price, and yield

Filter World by occupancy, ADR, yield, rent gap, and property price, then compare markets side by side.

Open Explorer

Find the Best Airbnb Markets with Our Interactive Tool

Use our interactive Market Explorer to find the best places to start an Airbnb in World. Compare multiple markets side by side, apply filters like regulations, budget (property or rent prices), and market size, and even export the results to Excel.

Explore Interactive Tool

Why Invest in Airbnb World in 2026?

The highest-graded short-term rental markets in World are Mexico City, Puerto Rico and Buenos Aires. The table ranks every tracked market by Airbtics Market Grade. Occupancy, average daily rate, annual revenue, yield, and revenue growth are the figures behind that grade.

Top 3 Airbnb markets in World by Market Grade

These are the three highest-graded Airbnb markets in World. Market Grade compares yield, revenue growth, and occupancy (demand) with the other markets on this page, then adjusts for short-term rental regulation. The chart repeats those three percentiles in text so the ranking is readable without the graphic.

Rank 1 — Mexico City (Grade A)

Mexico City is rank 1 of 100 markets in this World ranking by Airbtics Market Grade A, with 14.6% short-term rental yield, 65.0% occupancy, and +25.8% year-over-year revenue growth.

Compared with the other markets on this page, Mexico City ranks top 30% for yield, top 6% for growth, and top 47% for demand. The market shows an average daily rate of $82, annual revenue of $19,958, a rent gap of 3144.0%, 22,368 active listings, lenient short-term rental regulation, and a typical 2-bedroom property price of $200,000.

  • Market gradeA
  • Yield14.6%
  • Revenue growth+25.8%
  • Occupancy65.0%
  • Average daily rate$82
  • Annual revenue$19,958
  • Rent gap3144.0%
  • Active listings22,368
  • 2-bedroom price$200,000
  • RegulationLenient
top 30%Yieldtop 6%Growthtop 47%Demand

Percentile versus other World markets on this page. Farther from the center is stronger.

  • Yield: top 30%
  • Growth: top 6%
  • Demand: top 47%

Rank 2 — Puerto Rico (Grade A)

Puerto Rico is rank 2 of 100 markets in this World ranking by Airbtics Market Grade A, with 15.9% short-term rental yield, 60.0% occupancy, and +4.7% year-over-year revenue growth.

Compared with the other markets on this page, Puerto Rico ranks top 24% for yield, lowest 30% for growth, and lowest 38% for demand. The market shows an average daily rate of $170, annual revenue of $38,955, a rent gap of 3205.2%, 21,884 active listings, and a typical 2-bedroom property price of $250,000.

  • Market gradeA
  • Yield15.9%
  • Revenue growth+4.7%
  • Occupancy60.0%
  • Average daily rate$170
  • Annual revenue$38,955
  • Rent gap3205.2%
  • Active listings21,884
  • 2-bedroom price$250,000
top 24%Yieldlowest 30%Growthlowest 38%Demand

Percentile versus other World markets on this page. Farther from the center is stronger.

  • Yield: top 24%
  • Growth: lowest 30%
  • Demand: lowest 38%

Rank 3 — Buenos Aires (Grade A)

Buenos Aires is rank 3 of 100 markets in this World ranking by Airbtics Market Grade A, with 20.6% short-term rental yield, 73.0% occupancy, and +34.4% year-over-year revenue growth.

Compared with the other markets on this page, Buenos Aires ranks top 4% for yield, top 2% for growth, and top 24% for demand. The market shows an average daily rate of $60, annual revenue of $16,347, a rent gap of 4851.8%, 21,827 active listings, lenient short-term rental regulation, and a typical 2-bedroom property price of $120,000.

  • Market gradeA
  • Yield20.6%
  • Revenue growth+34.4%
  • Occupancy73.0%
  • Average daily rate$60
  • Annual revenue$16,347
  • Rent gap4851.8%
  • Active listings21,827
  • 2-bedroom price$120,000
  • RegulationLenient
top 4%Yieldtop 2%Growthtop 24%Demand

Percentile versus other World markets on this page. Farther from the center is stronger.

  • Yield: top 4%
  • Growth: top 2%
  • Demand: top 24%

Market Rankboard: World

Each dot is a vacation rental market in World, plotted by occupancy rate (x-axis) and average daily rate (ADR) (y-axis). Dashed lines mark the national median.

World Airbnb markets rankboard scatter chart showing occupancy rate versus average daily rate (ADR)
Occupancy rate and average daily rate for each World market plotted in the chart above, in Market Grade order.
MarketOccupancy rateAverage daily rate
Mexico City65.0%$82
Puerto Rico60.0%$170
Buenos Aires73.0%$60
Otago73.0%$214
Paris80.0%$199
Rio De Janeiro59.0%$81
Rome76.0%$173
Melbourne66.0%$170
Lake Buena Vista68.0%$257
Phuket61.0%$85
Athens69.0%$99
Jeju Island59.0%$85
Budapest80.0%$93
Jamaica45.0%$122
Valais56.0%$248
Jacksonville62.0%$240
Warsaw67.0%$91
Nashville61.0%$258
Marseille70.0%$122
Málaga84.0%$149
Chiang Mai64.0%$46
Krakow75.0%$96
Sevilla77.0%$145
Oahu83.0%$261
Gdansk60.0%$113
Berlin74.0%$144
Dubai69.0%$181
Cape Town66.0%$103
Goa48.0%$44
Malta77.0%$140
Madeira83.0%$152
Busan67.0%$82
Extended Grand Paris73.0%$152
London71.0%$206
Bali58.0%$89
Big Los Angeles64.0%$254
QueensLand And Northern NSW69.0%$206
Dominican Republic43.0%$90
Metro Manila48.0%$36
Seoul83.0%$85
Lima52.0%$52
Lisbon76.0%$132
Cornwall60.0%$192
Ubatuba44.0%$81
Las Vegas59.0%$215
Florence71.0%$172
Los Angeles70.0%$230
Hanoi42.0%$34
San Diego74.0%$281
Austin61.0%$196
Vienna74.0%$135
Naples64.0%$112
Guarujá39.0%$94
Miami65.0%$231
Salvador de Bahia52.0%$55
Venice69.0%$200
Reunion island69.0%$109
Bahia De Banderas48.0%$154
Tbilisi64.0%$45
Bengaluru45.0%$25
Oslo69.0%$156
Florianpolis56.0%$85
Bangkok62.0%$50
Madrid81.0%$149
Ho Chi Minh City53.0%$45
Sydney75.0%$198
Santiago de Chille57.0%$55
Riyadh36.0%$82
Guanajuato City49.0%$63
Barcelona83.0%$221
Toronto71.0%$138
Copenhagen81.0%$222
Houston54.0%$181
Porto73.0%$106
Lake Garda62.0%$182
Prague78.0%$123
Cairo50.0%$53
Istanbul52.0%$70
Cabo Frio43.0%$77
São Sebastião41.0%$143
Sao Paulo58.0%$53
New York71.0%$169
Lake Como62.0%$191
Cannes50.0%$203
Nairobi43.0%$44
Tokyo84.0%$125
Kuala Lumpur56.0%$54
Milano68.0%$153
Marrakech58.0%$86
Pattaya56.0%$48
Nice74.0%$159
Playa del Carmen53.0%$81
Praia Grande39.0%$64
Puerto Vallarta53.0%$127
Maui74.0%$376
Martinique64.0%$114
Big Island69.0%$280
Osaka66.0%$79
Cuba40.0%$35
Tulum43.0%$83

Compare property prices, short-term rental yield, rent gap, annual revenue, and supply growth in the Airbtics Market Explorer watchlist.

See all Airbnb markets in World

Browse all 1,577 markets we track worldwide, A to Z. Each link opens the market's Airbnb revenue and performance data page.

Popular market shortlists

A

B

C

L

M

P

S

World Airbnb market FAQs

  • What are the best Airbnb markets in World?

    Airbtics ranks short-term rental markets in World by Market Grade. The grade compares yield (annual revenue divided by property price), year-over-year revenue growth, and occupancy, then adjusts for regulation. The highest-graded market in this dataset is Mexico City. The main table lists markets in that order; use the Market Explorer to filter by budget, regulations, and more.

  • How many Airbnb markets does Airbtics track in World?

    We currently analyze 100 active short-term rental markets in World with listing supply, median occupancy, ADR, and revenue estimates.

  • What is the average Airbnb occupancy rate in World?

    The national average occupancy rate across tracked markets is 62.91% (LTM). Rates differ by city. Use the rankboard on this page, or open a market page for that city's numbers.

  • How do I compare Airbnb markets in World?

    Use the occupancy vs ADR rankboard on this page for a quick view, or open the Market Explorer to compare markets side by side, change chart axes, export to Excel, and save markets to a watchlist.

  • How can I estimate Airbnb income in World?

    Use our Airbnb income calculator to estimate revenue for a specific address, or open any market link below for median revenue and occupancy benchmarks.





Estimate Your Airbnb Income in World


Ready to start looking for the most profitable short-term rental investment opportunities in World?

Use our Airbnb calculator to quickly and accurately estimate the earning and profitability potential of any city, neighborhood, and area.

Try Our Airbnb Calculator

For trends, supply, and year-over-year changes, see the 2025 short-term rental report for World.